Design

Yahoo – Rize Design System

How I helped evolve Yahoo’s design system to support consistency, accessibility, and team adoption across a global product ecosystem.

Media

Digital

Context + Problem

Business Problem
Yahoo’s ad tech tools were inconsistent, inefficient, and hard to maintain. Multiple teams worked off different design libraries, leading to redundant tools, wasted time, and higher dev costs.

People Problem
Designers were constantly detaching components, suffering from poor documentation, and lacked a single source of truth. Design maturity was low, and collaboration was difficult.

Your Role
Design system lead (alongside 1 PM + 1 visual designer):

  • Drove the Figma migration
  • Designed the component library
  • Led training, advocacy, accessibility audits
  • Created documentation and system principles

Goals & Constraints

  • Goals:
    • Consolidate tools
    • Speed up product development
    • Improve design quality + accessibility
    • Increase collaboration and adoption

  • Constraints:
    • Migrated mid-rebrand (Verizon branding retired)
    • Figma learning curve for many designers
    • Leadership wanted 6–12 month project done in 3

My first year on the Data Viz team‍


How I Earned The Role

In my first year on the Data Viz team, I handled complex enterprise interactions and built a custom system that helped my team move faster. When the original DS lead left, I stepped in and shared that work across the org, which helped build trust and momentum.

My experience leading the Yahoo Design System for more than 30 designers, along with my work on Dan Mall’s DSU advisory board, strengthened my credibility and positioned me to lead Mockingjay.

DSU's Customer Advisory Board
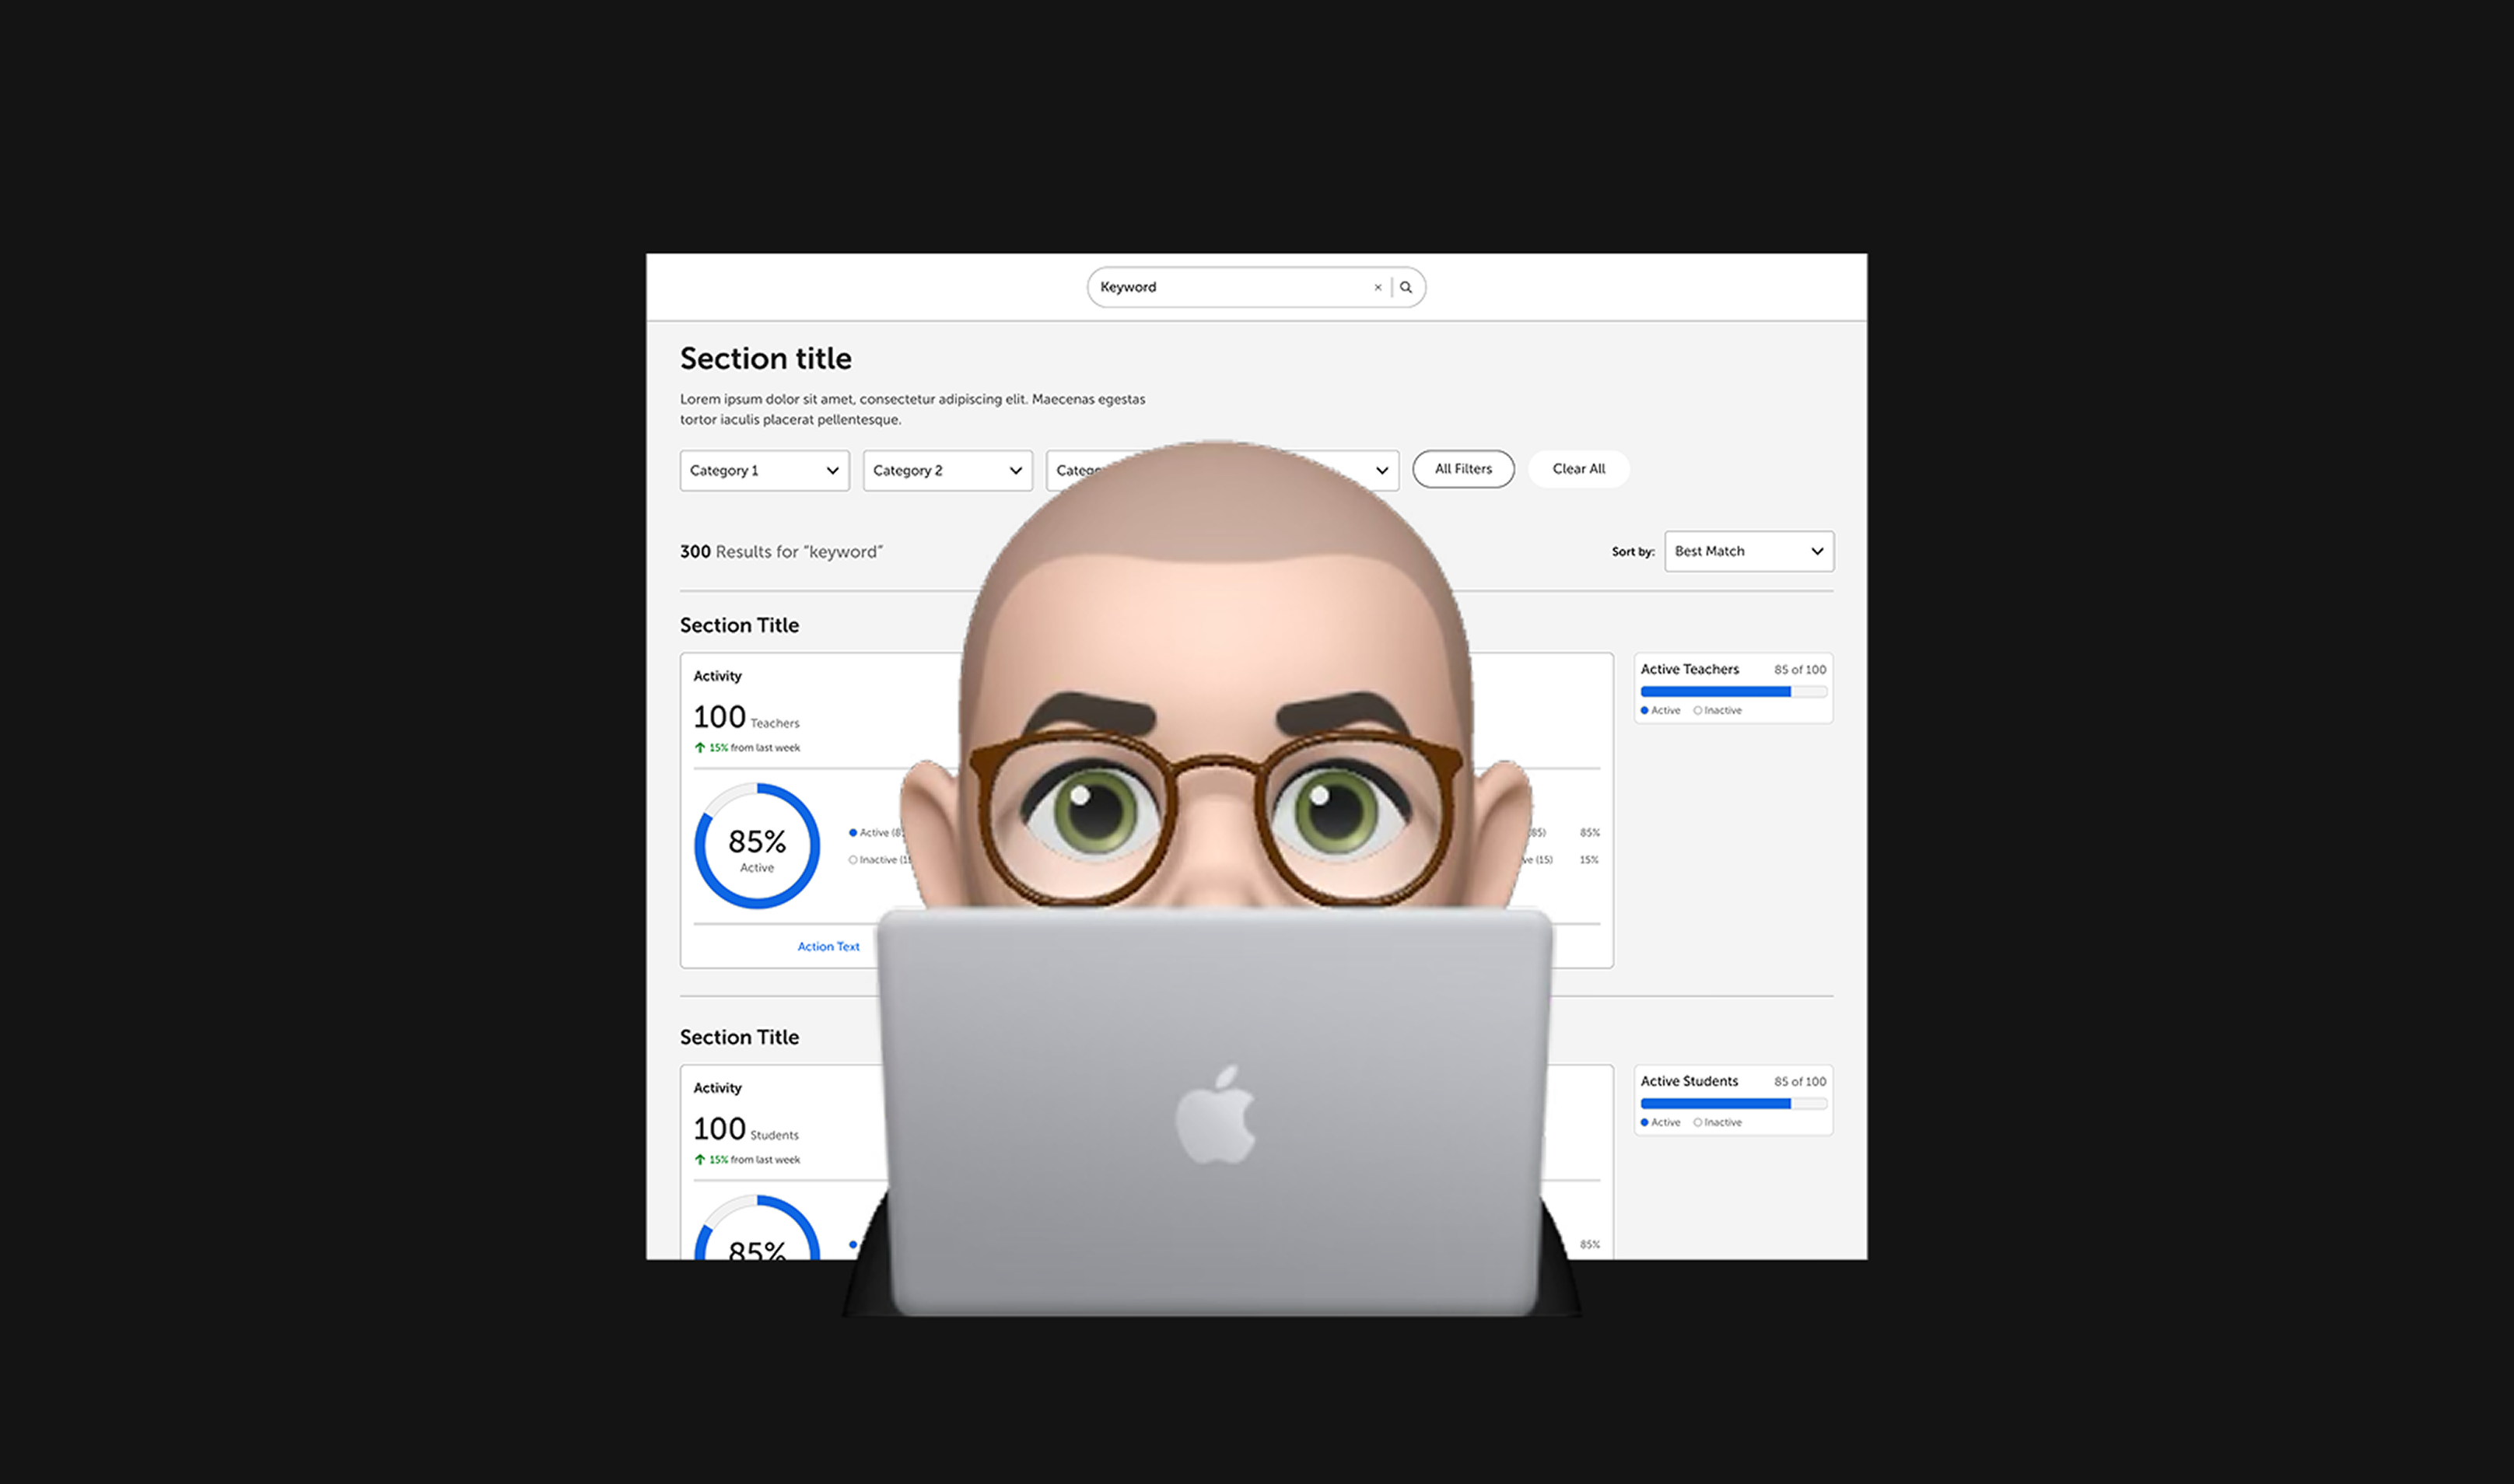
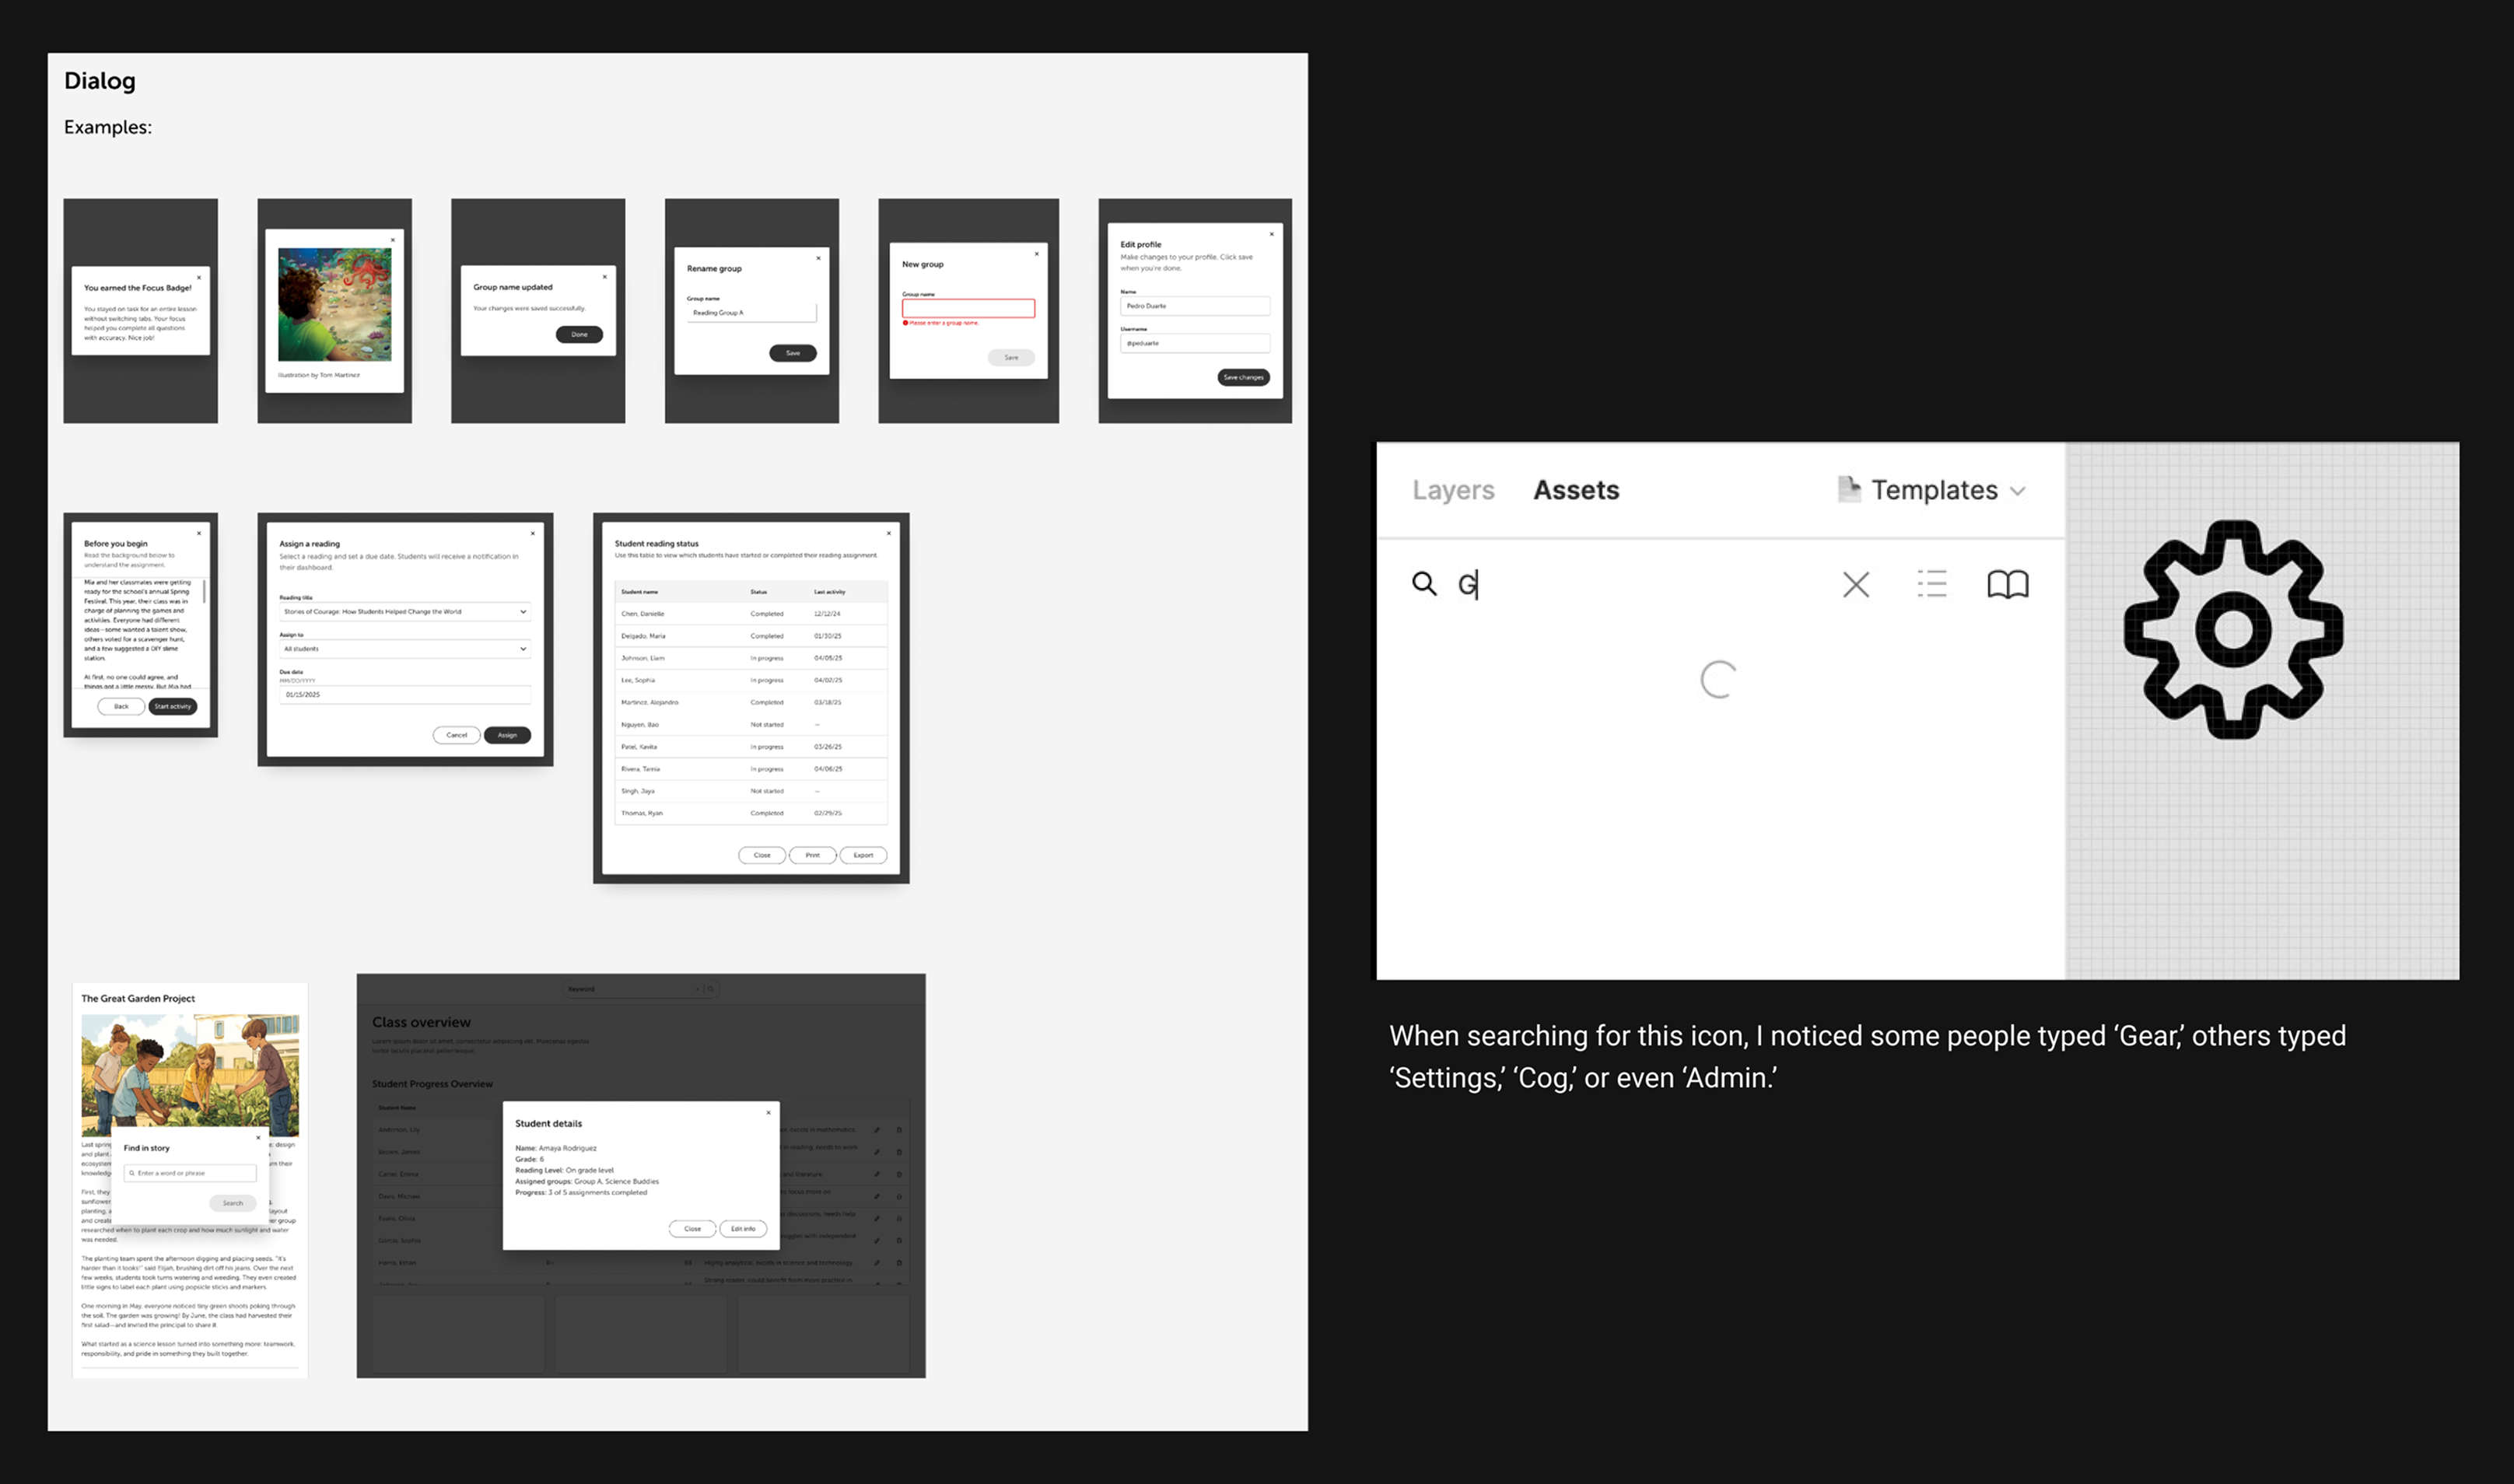
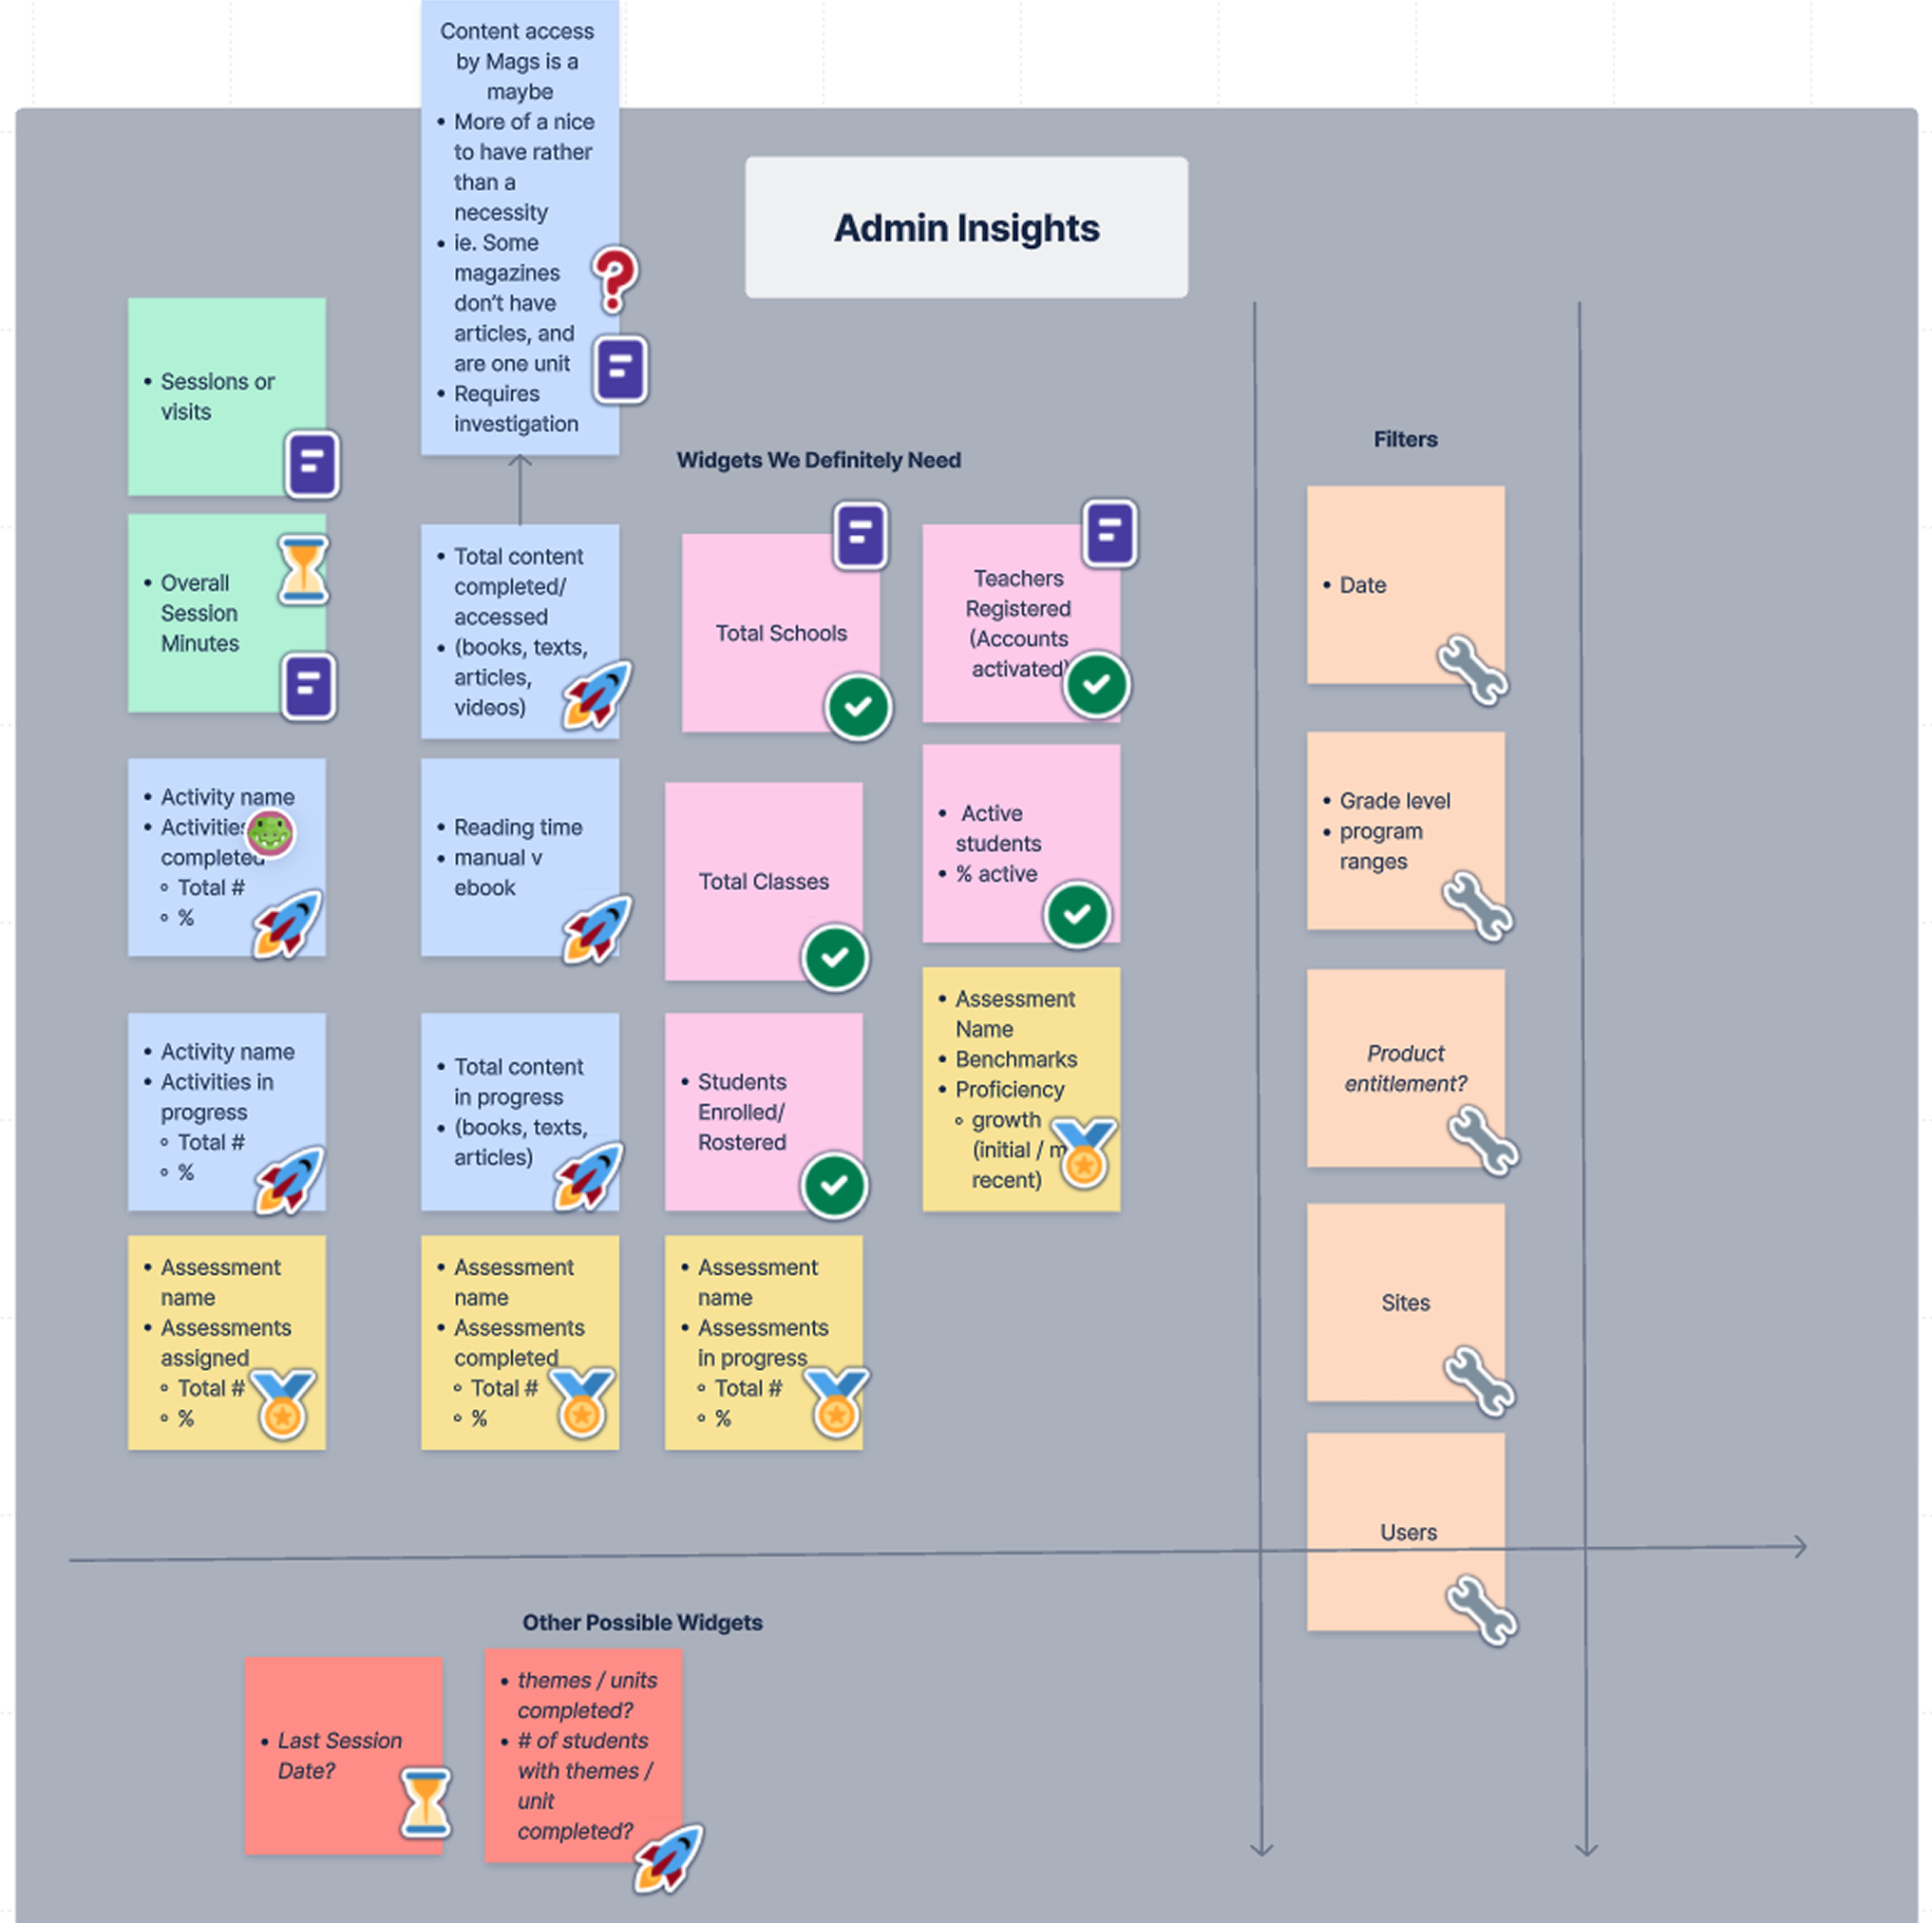

  • Design Tactics:
    • Separated distinct variants (e.g., button styles) for faster drag-and-drop
    • Used labels, emoji, and screenshots to enhance discoverability
    • Created interactive prototypes for non-design stakeholders
    • Added metadata (Gear, Cog, Settings, etc.) to support diverse vocabularies
    • Surface GitHub links to enable cross-functional collaboration

The DS Team at Scholastic

Establishing a System Mindset

To move the organization forward, I knew we needed a shared understanding of what a design system really is. I suggested that a small group take a design systems course early, so we could align on the principles needed to build something scalable and usable. Leadership approved it, and three of us took Dan Mall’s course together. It gave us a shared language, a common mindset, and a solid foundation to move forward as a unified team.

Leveling up together


Listening First: Research Across the Org

We met with senior leaders, PMs, engineers, and designers across the organization to understand their expectations and challenges. I asked how they defined a design system, what successful adoption looked like, and where the gaps were.

Common themes

  • Lack of documentation
  • No accessibility guidance
  • Low adoption
  • Inconsistent support
  • No shared vocabulary
  • Unclear starting point for teams

Listening first gave me a clear picture of what teams truly needed and helped shape a system grounded in real problems.

Listening First: Key Findings


Building the foundation

Audits and extraction

I reviewed old style guides, previous system attempts, and product UI across teams. I extracted reusable decisions to build a more stable foundation.

Token architecture

I worked with engineers early and agreed on a Tailwind-compatible structure. I taught myself Token Studio so I could generate JSON that engineering could use into their build process.

This helped build trust and saved engineering hours on mapping design to code.

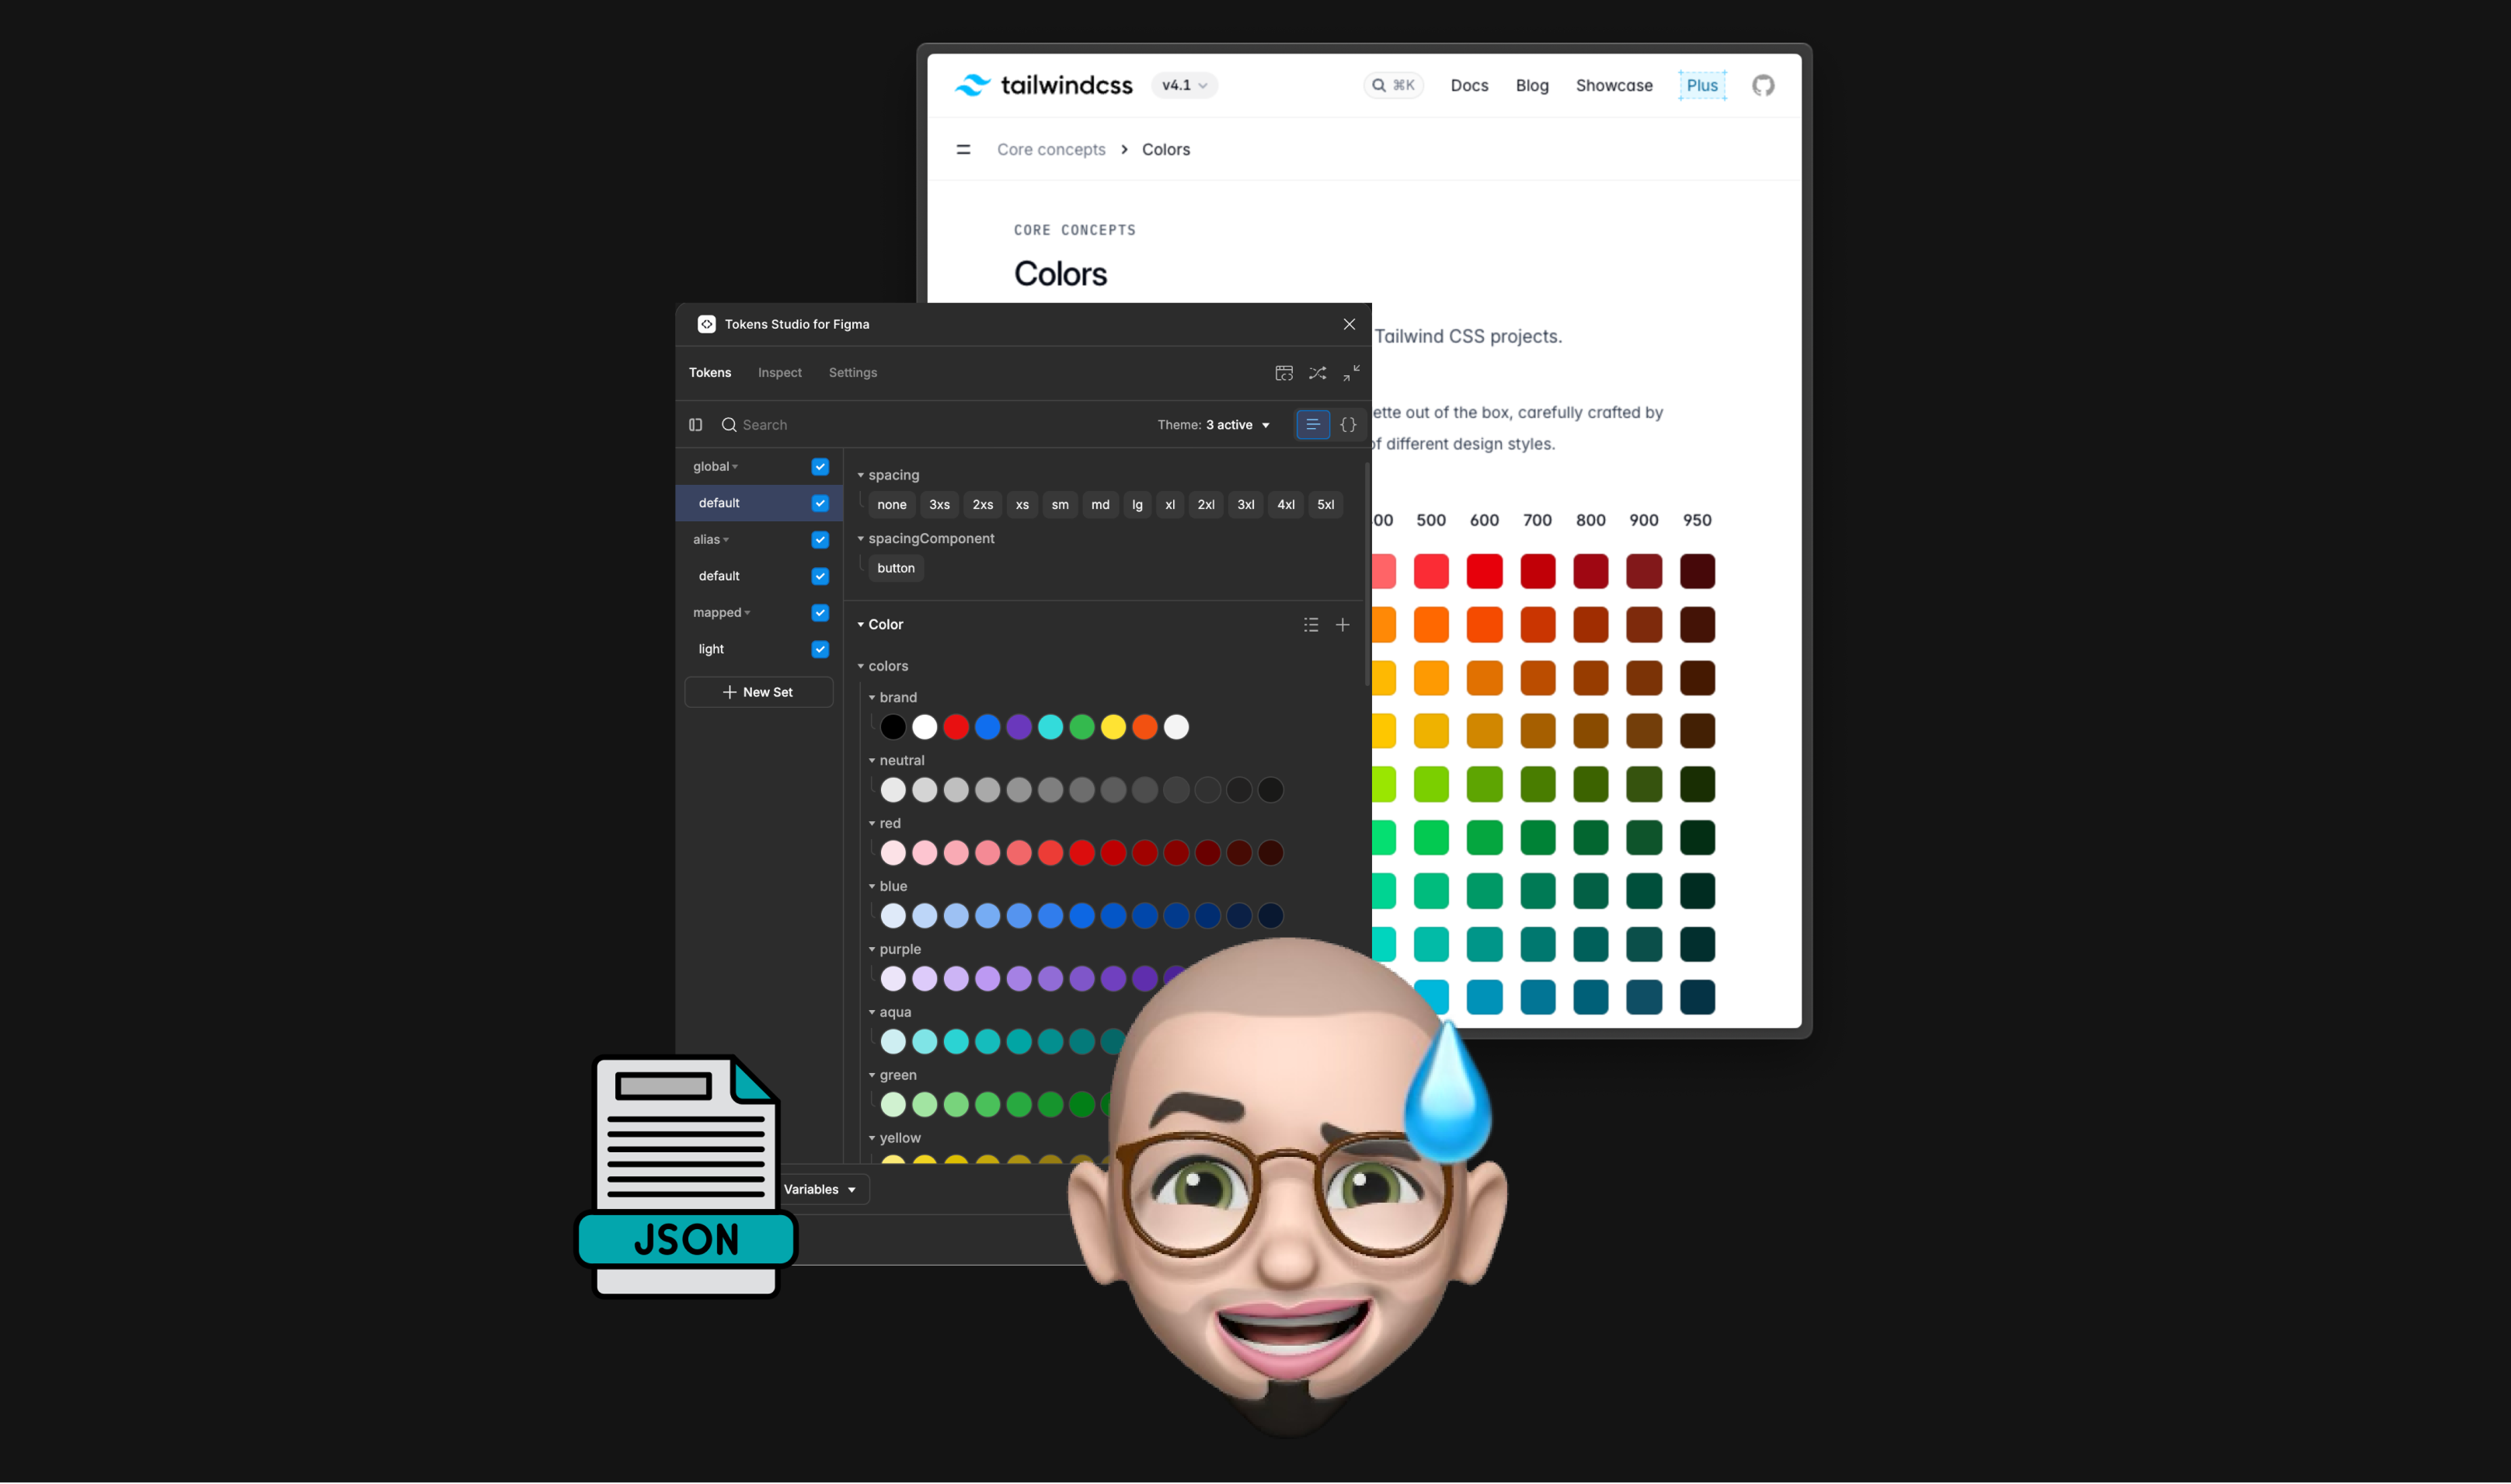
Taught myself Token Studio to generate JSON from Figma


An Inclusive Entry Point For Everyone

Different roles needed different ways in.

  • Designers used Figma.
  • Engineers used Git and Storybook.
  • PMs needed a clear place to browse.

Mockingjay on Zeroheight became the central hub. No matter your role, you could start from where you were most comfortable.

This boosted adoption and made the system feel approachable.

Different roles, different ways in — same source of truth


Design Decisions With Intention

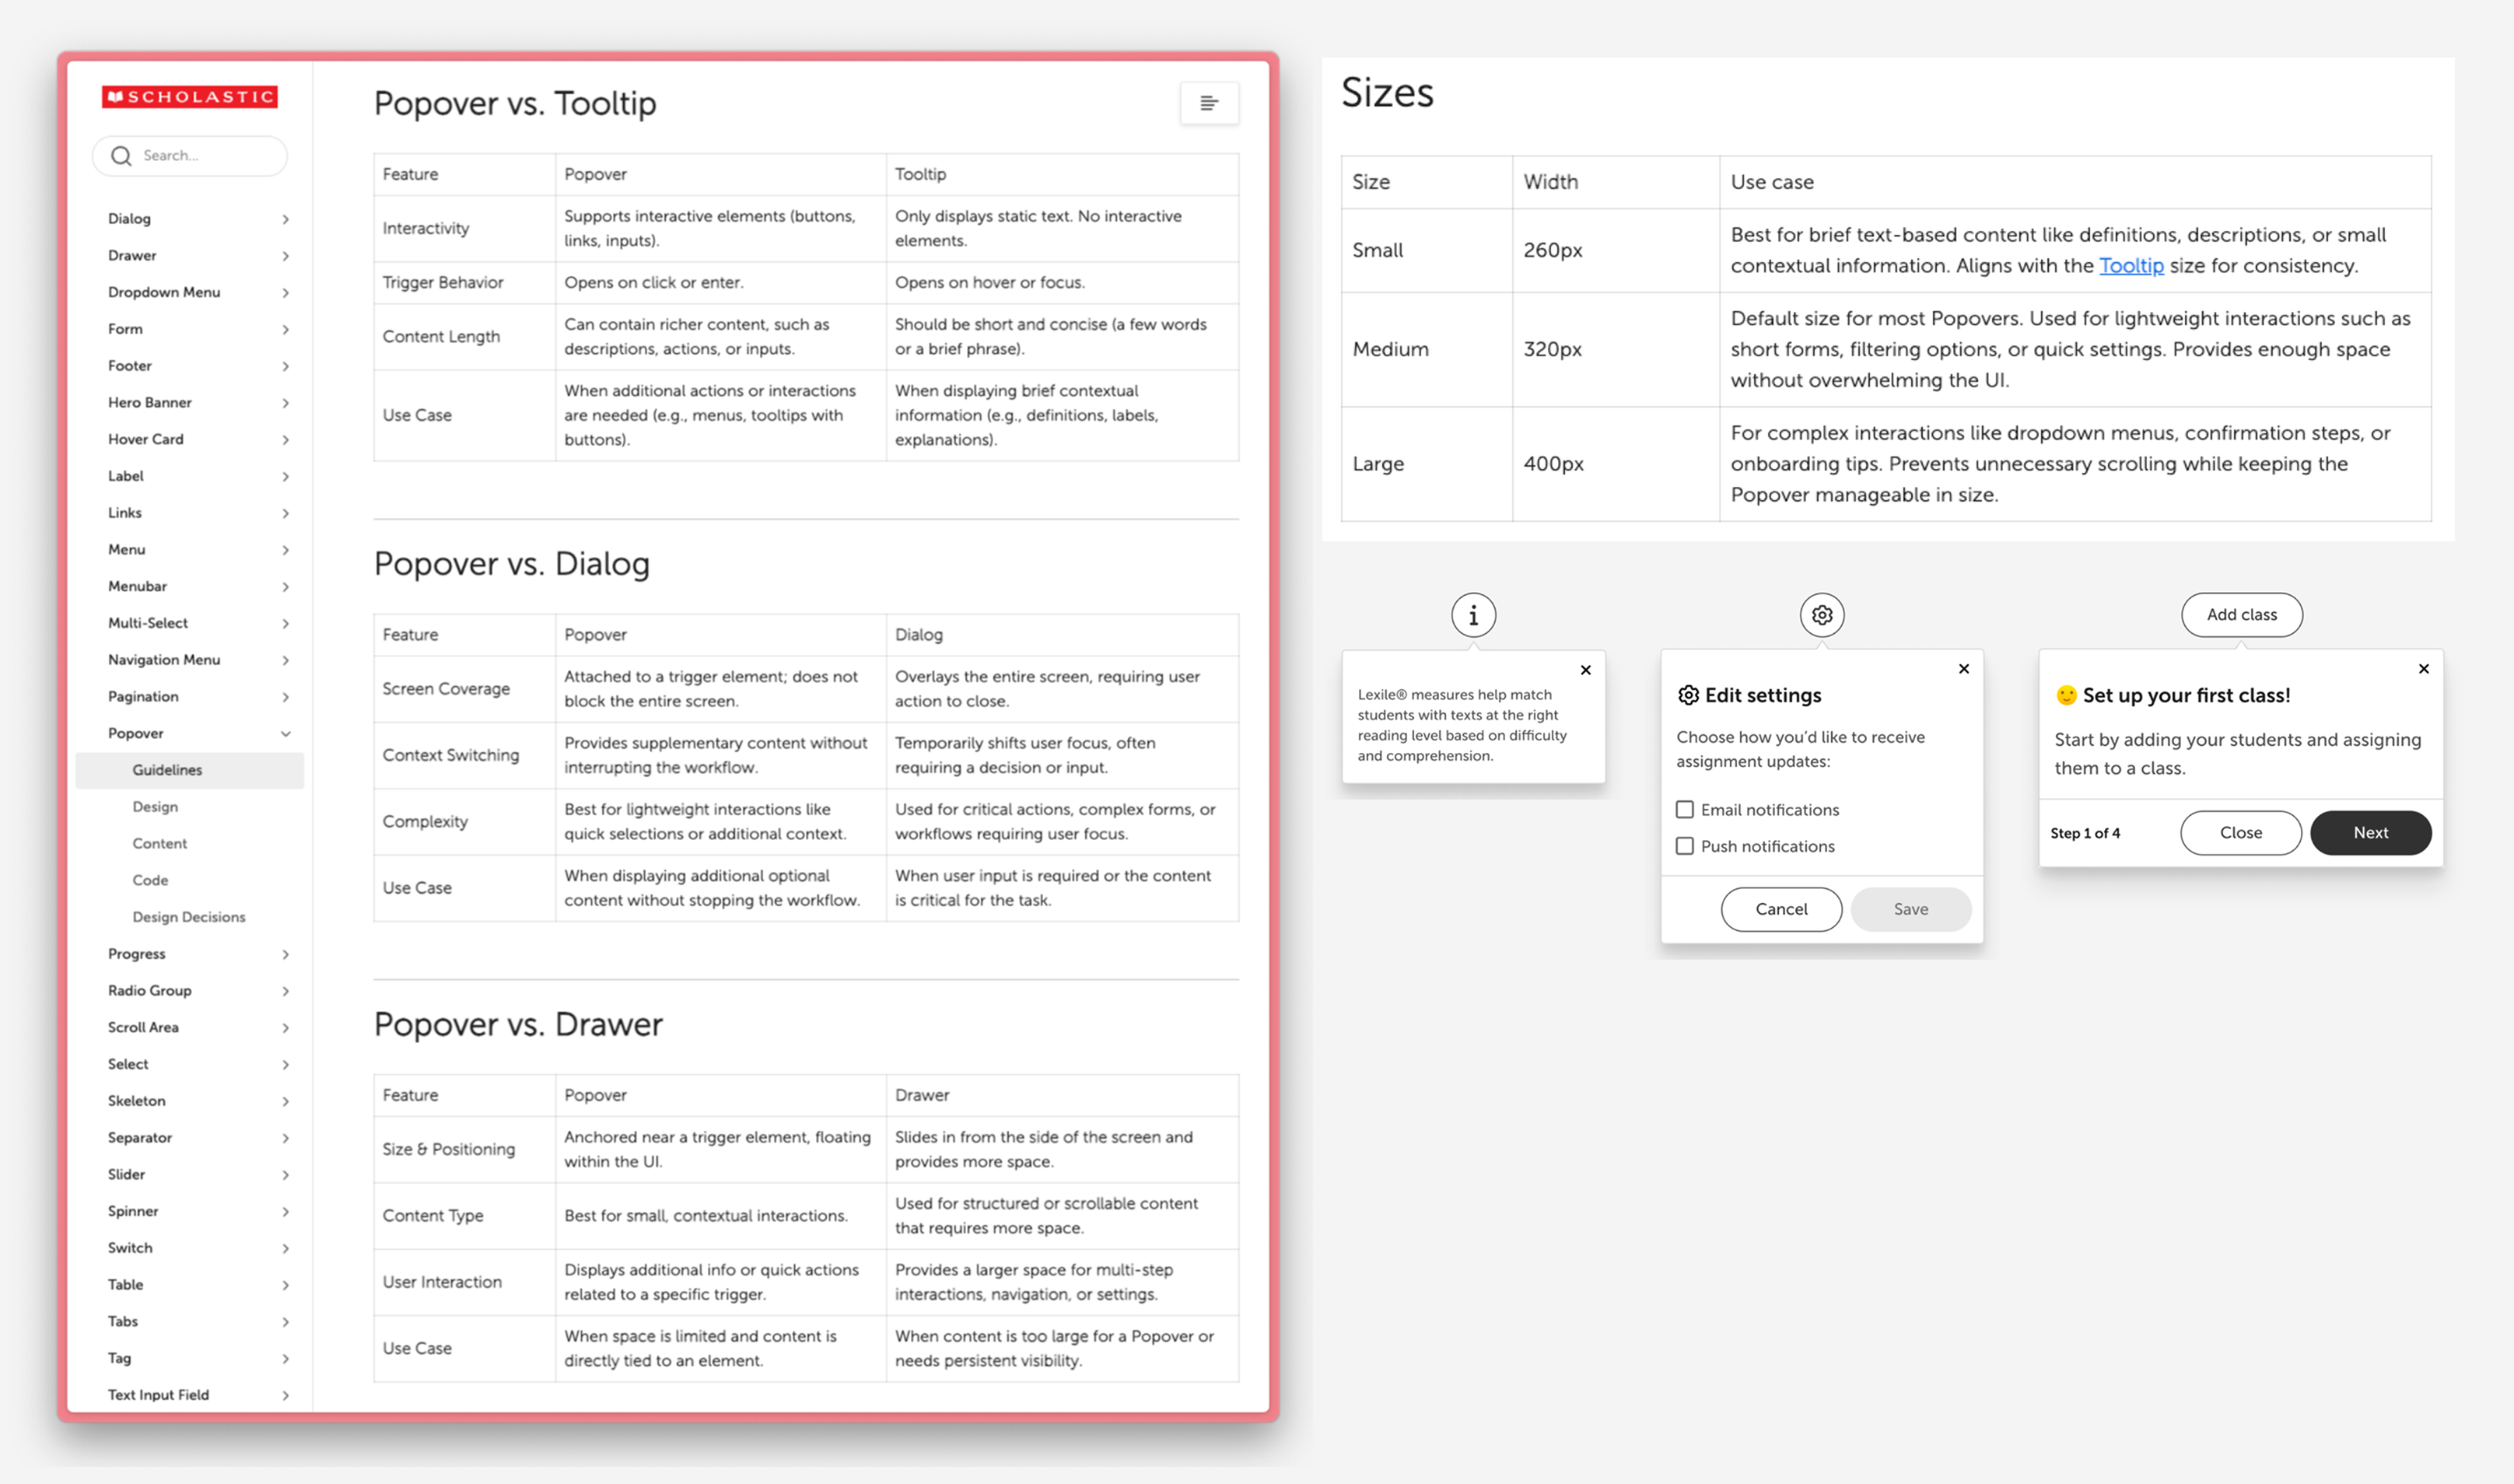
I documented not just the “What,” but the “Why.”

Examples

  • Popover vs Dialog vs Drawer
  • When to use which and why
  • Sizing rules
  • Behavior expectations
  • Best practices that matched engineering constraints

This reduced ambiguity and helped teams make faster decisions with fewer reviews.

Design decisions with intention

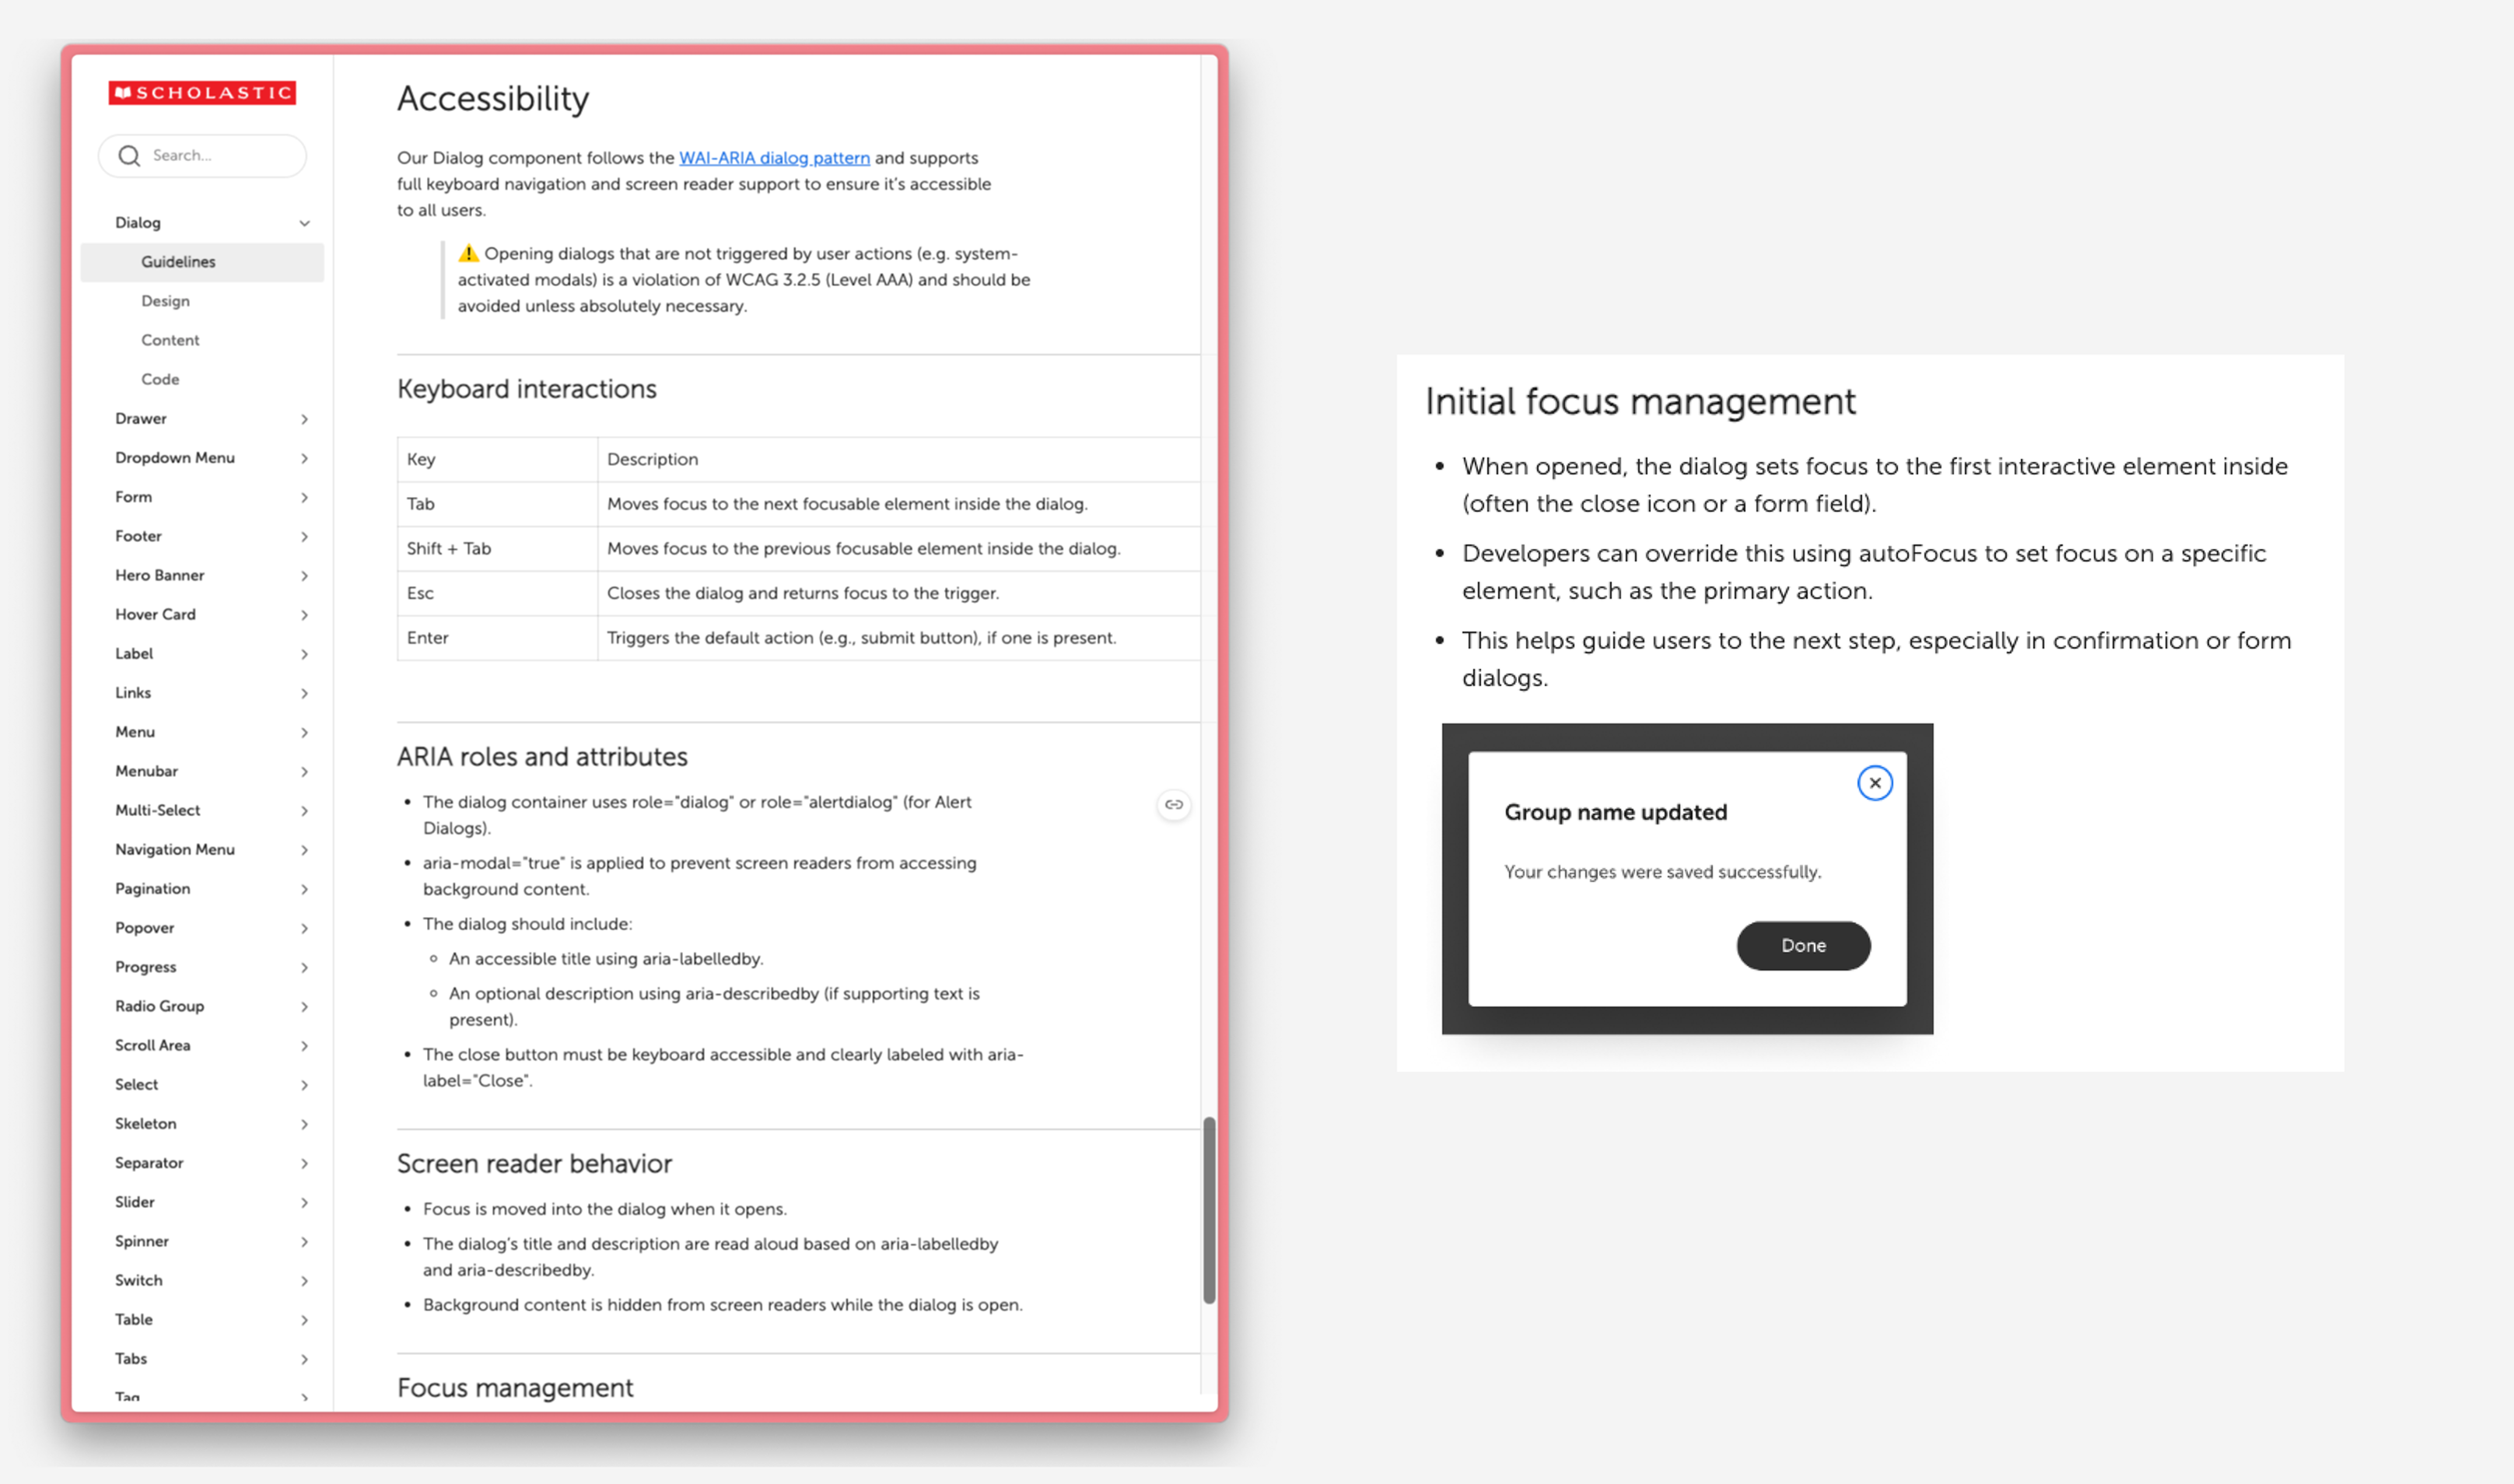
Accessibility Built Into the System

Public school products must meet strict accessibility requirements, and without them, our products cannot be sold to schools. Engineers needed clear and actionable guidance, so I documented ARIA roles, focus behavior, keyboard patterns, and accessible defaults.

I also served as a design advocate in our Accessibility Center of Excellence (ACE), helping teams shift from “checking the box” to designing with inclusion from the start.

Accessibility became a core value of the system.

Accessibility built in


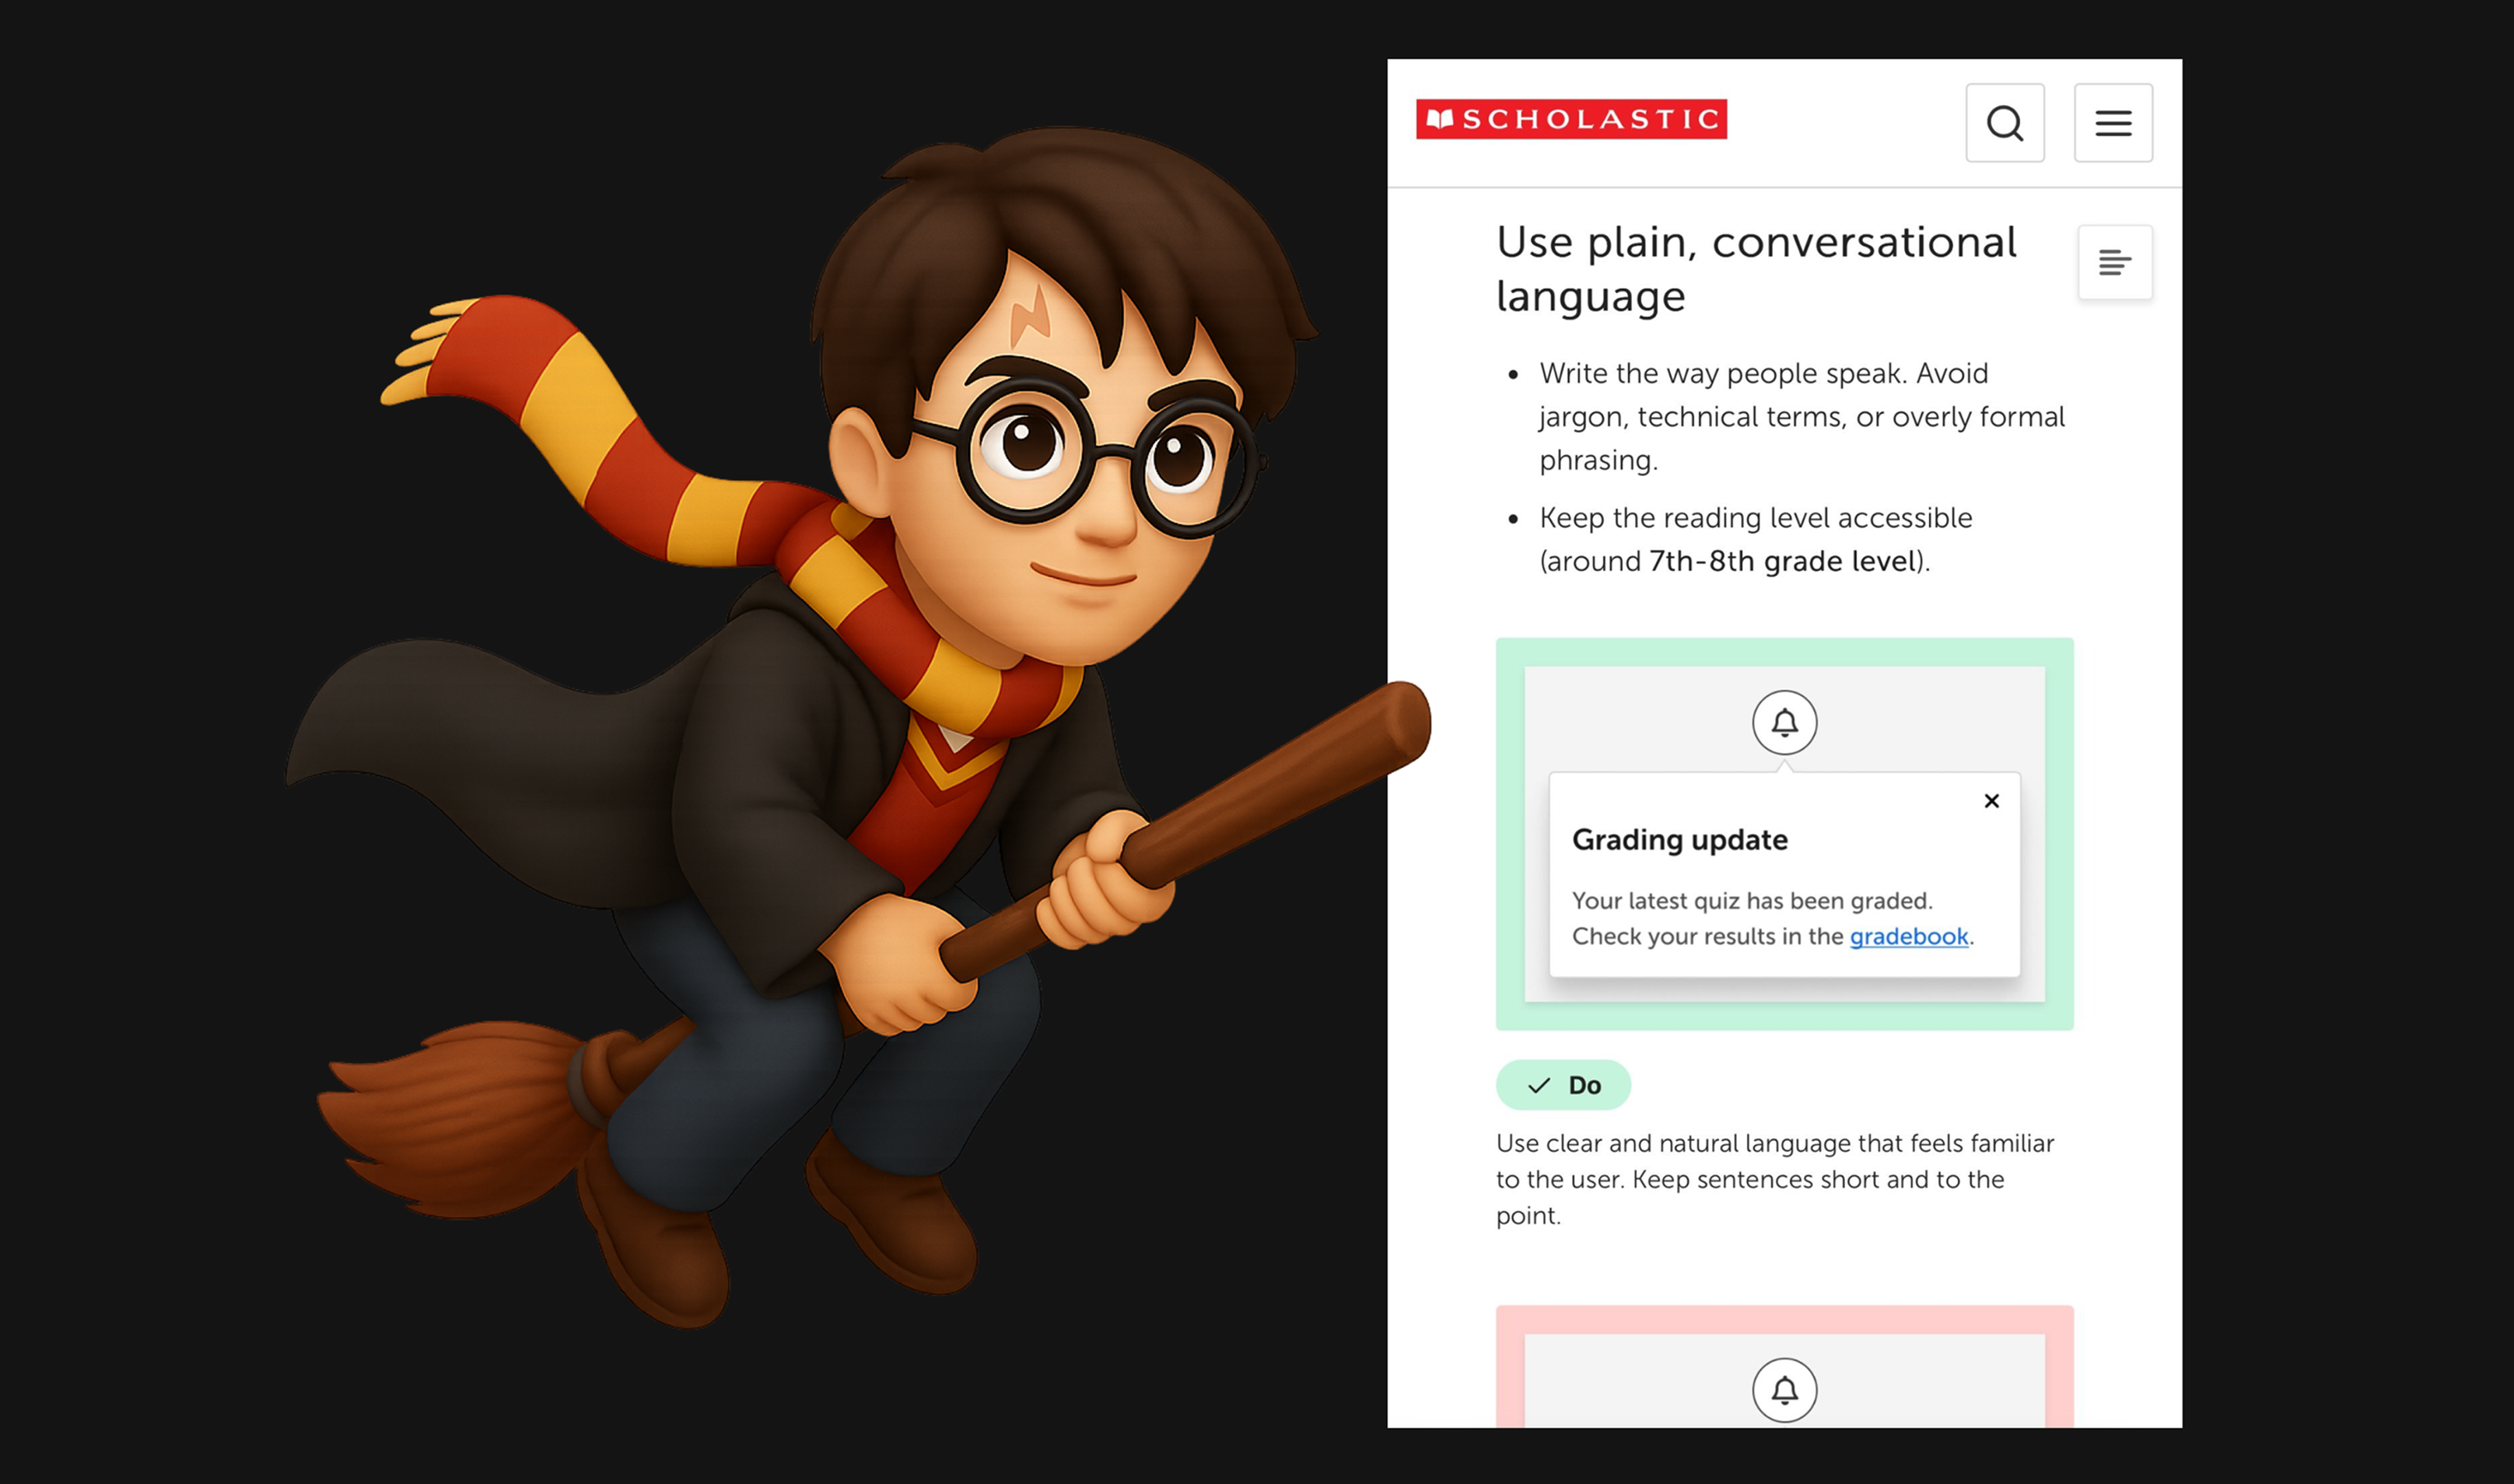
Writing For Everyone

Documentation was written at a seventh to eighth grade reading level to ensure clarity for everyone. This helped:

  • ESL team members
  • Non technical roles
  • New designers
  • New engineers

I focused on clear, simple language over complexity.

I used Scholastic’s own Harry Potter series as inspiration. Part of its success comes from being written in a way that readers of many ages and reading levels can understand it. I brought that same approach to our internal documentation.

Inspired by how Harry Potter is written


Process For Faster Work

Figma sticker sheets

I created grab-and-go layouts based on real product patterns. Designers did not need to customize or rebuild components. They copy and paste.

This cut design time and improved consistency.

Metadata and search

Different teams used different words for the same thing, so I added alternate keywords to help everyone find what they needed.

Designing for how people work and think


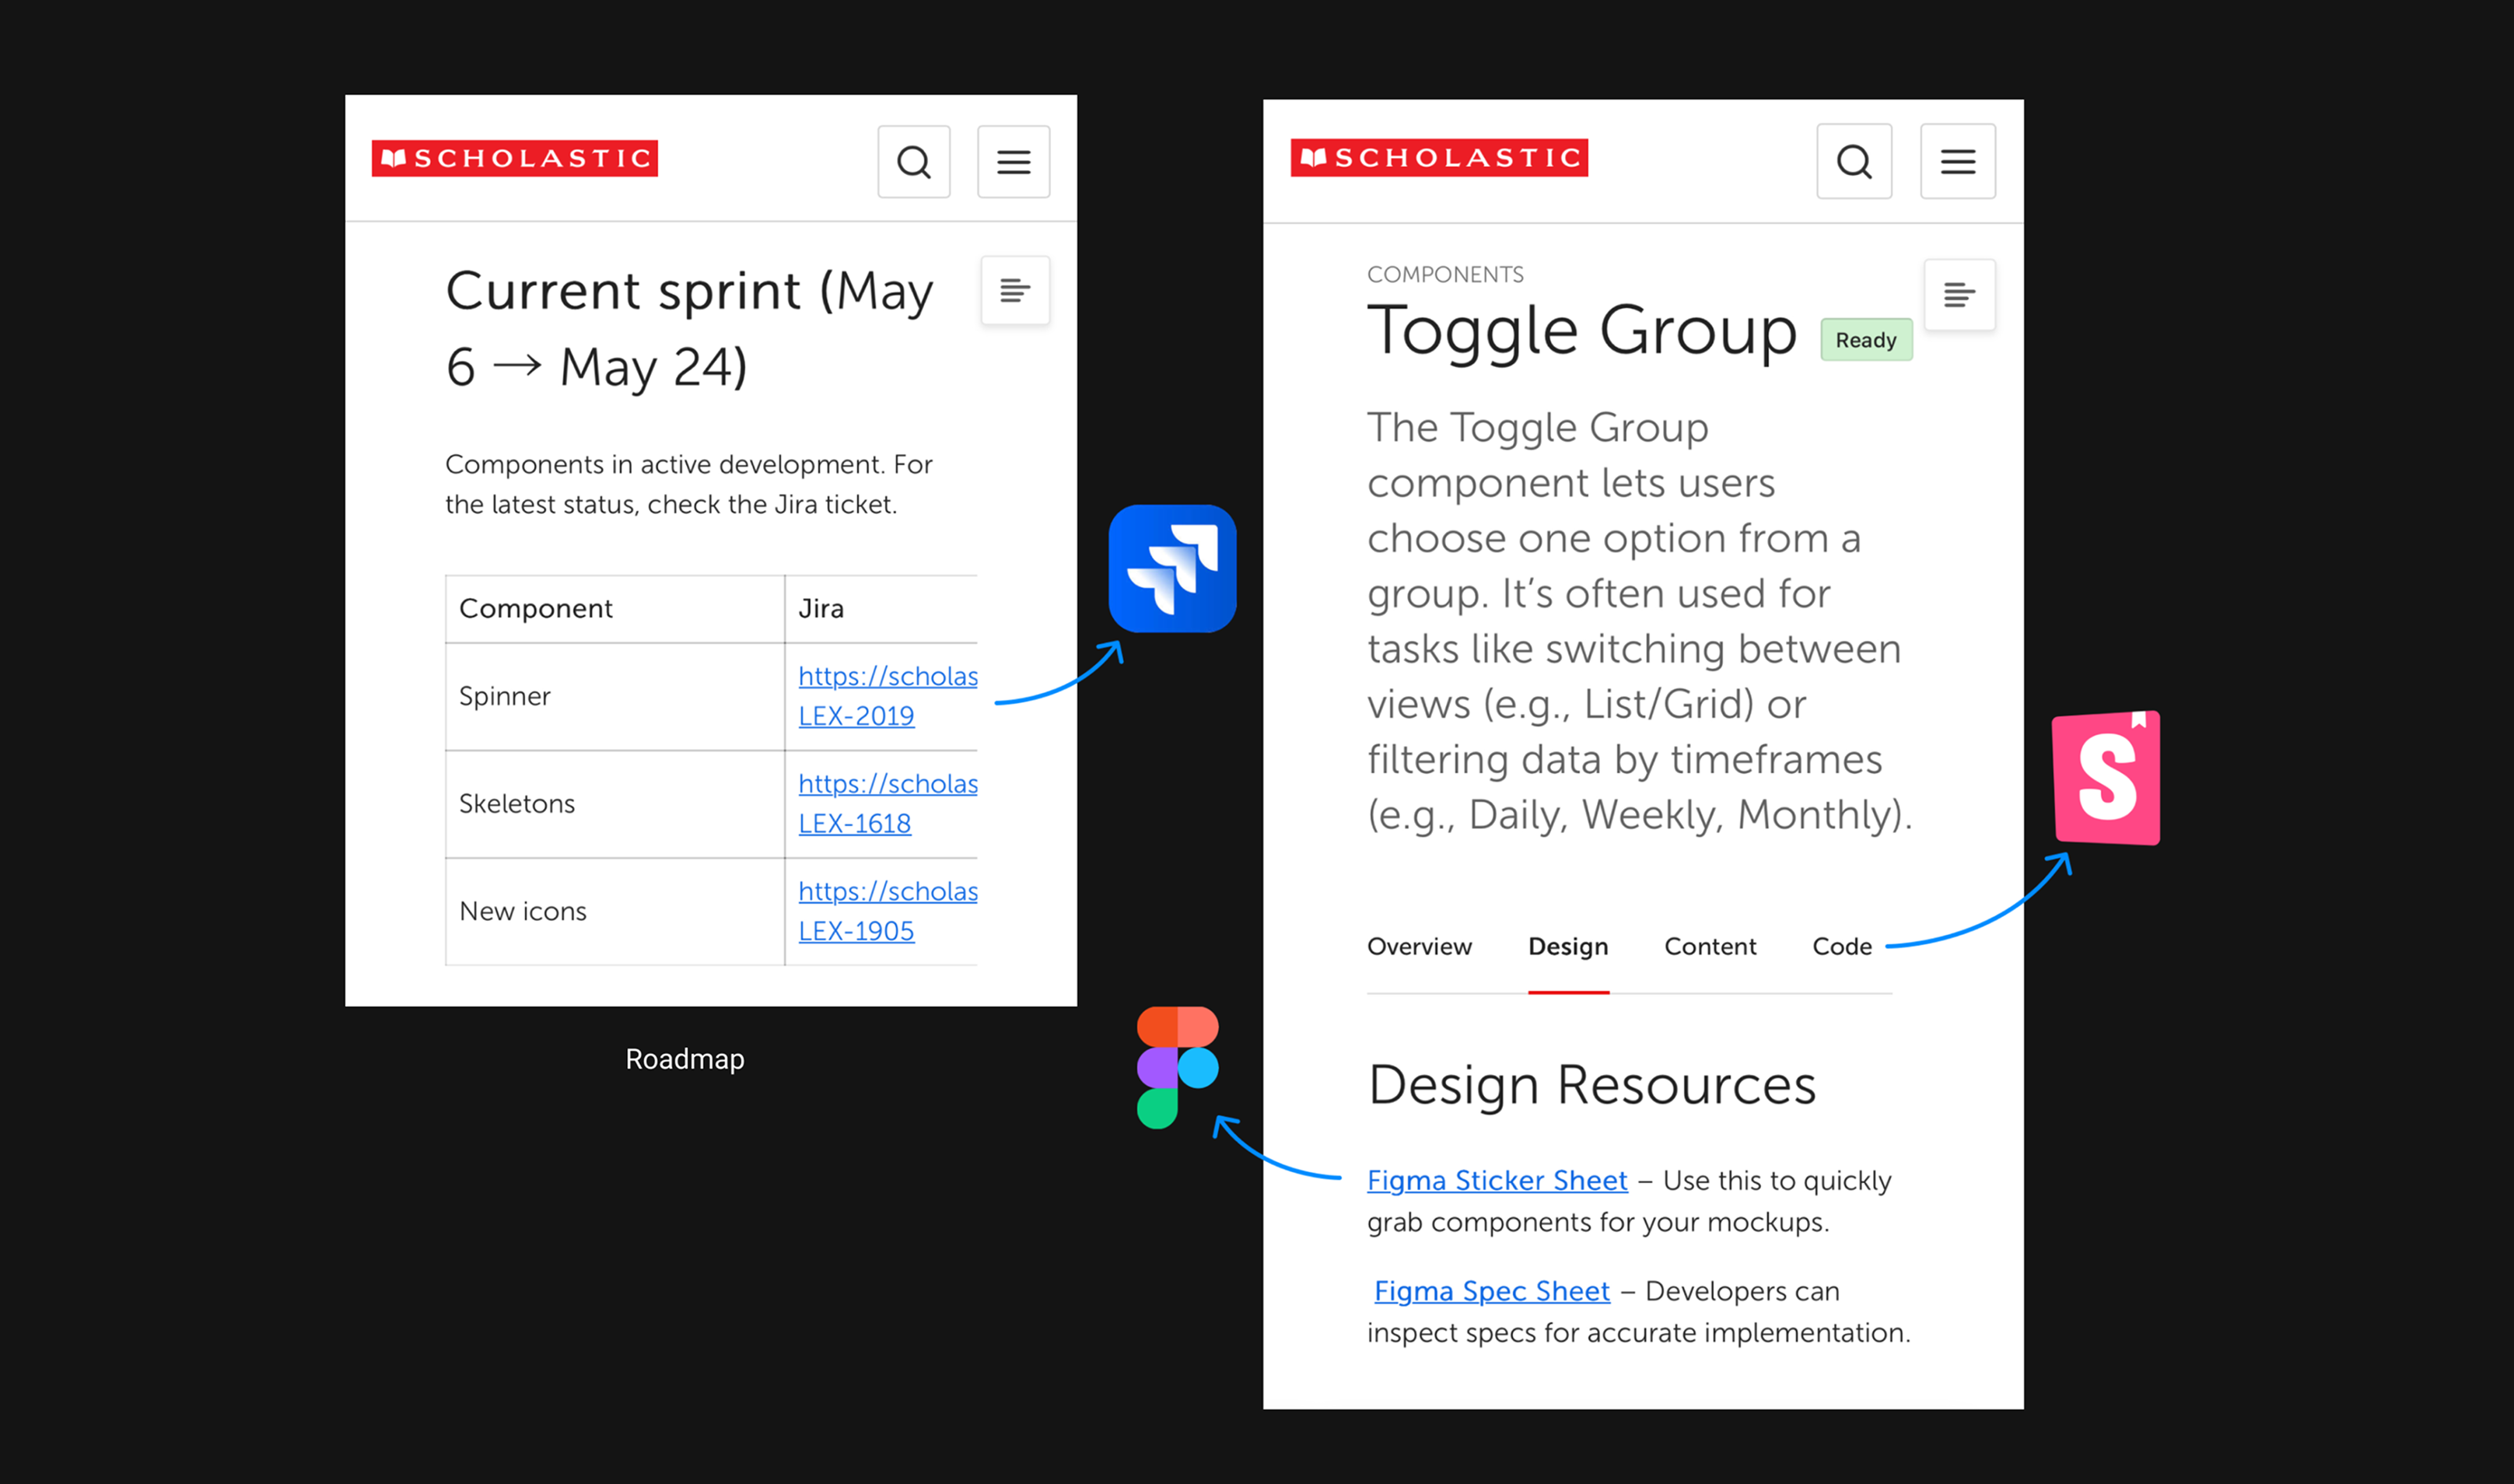
Everything Stays Connected

To make the system easy for everyone to use, I connected design, code, and documentation in one flow. From Figma, teams could jump directly to Storybook for engineering details and to Zeroheight for full documentation. No one had to search for specs or wonder where anything lived. Every component carried its own links, so the context traveled with it.

This kept designers and engineers aligned, reduced back-and-forth, and made the system simple to use across all tools.

Extending design to code + documentation
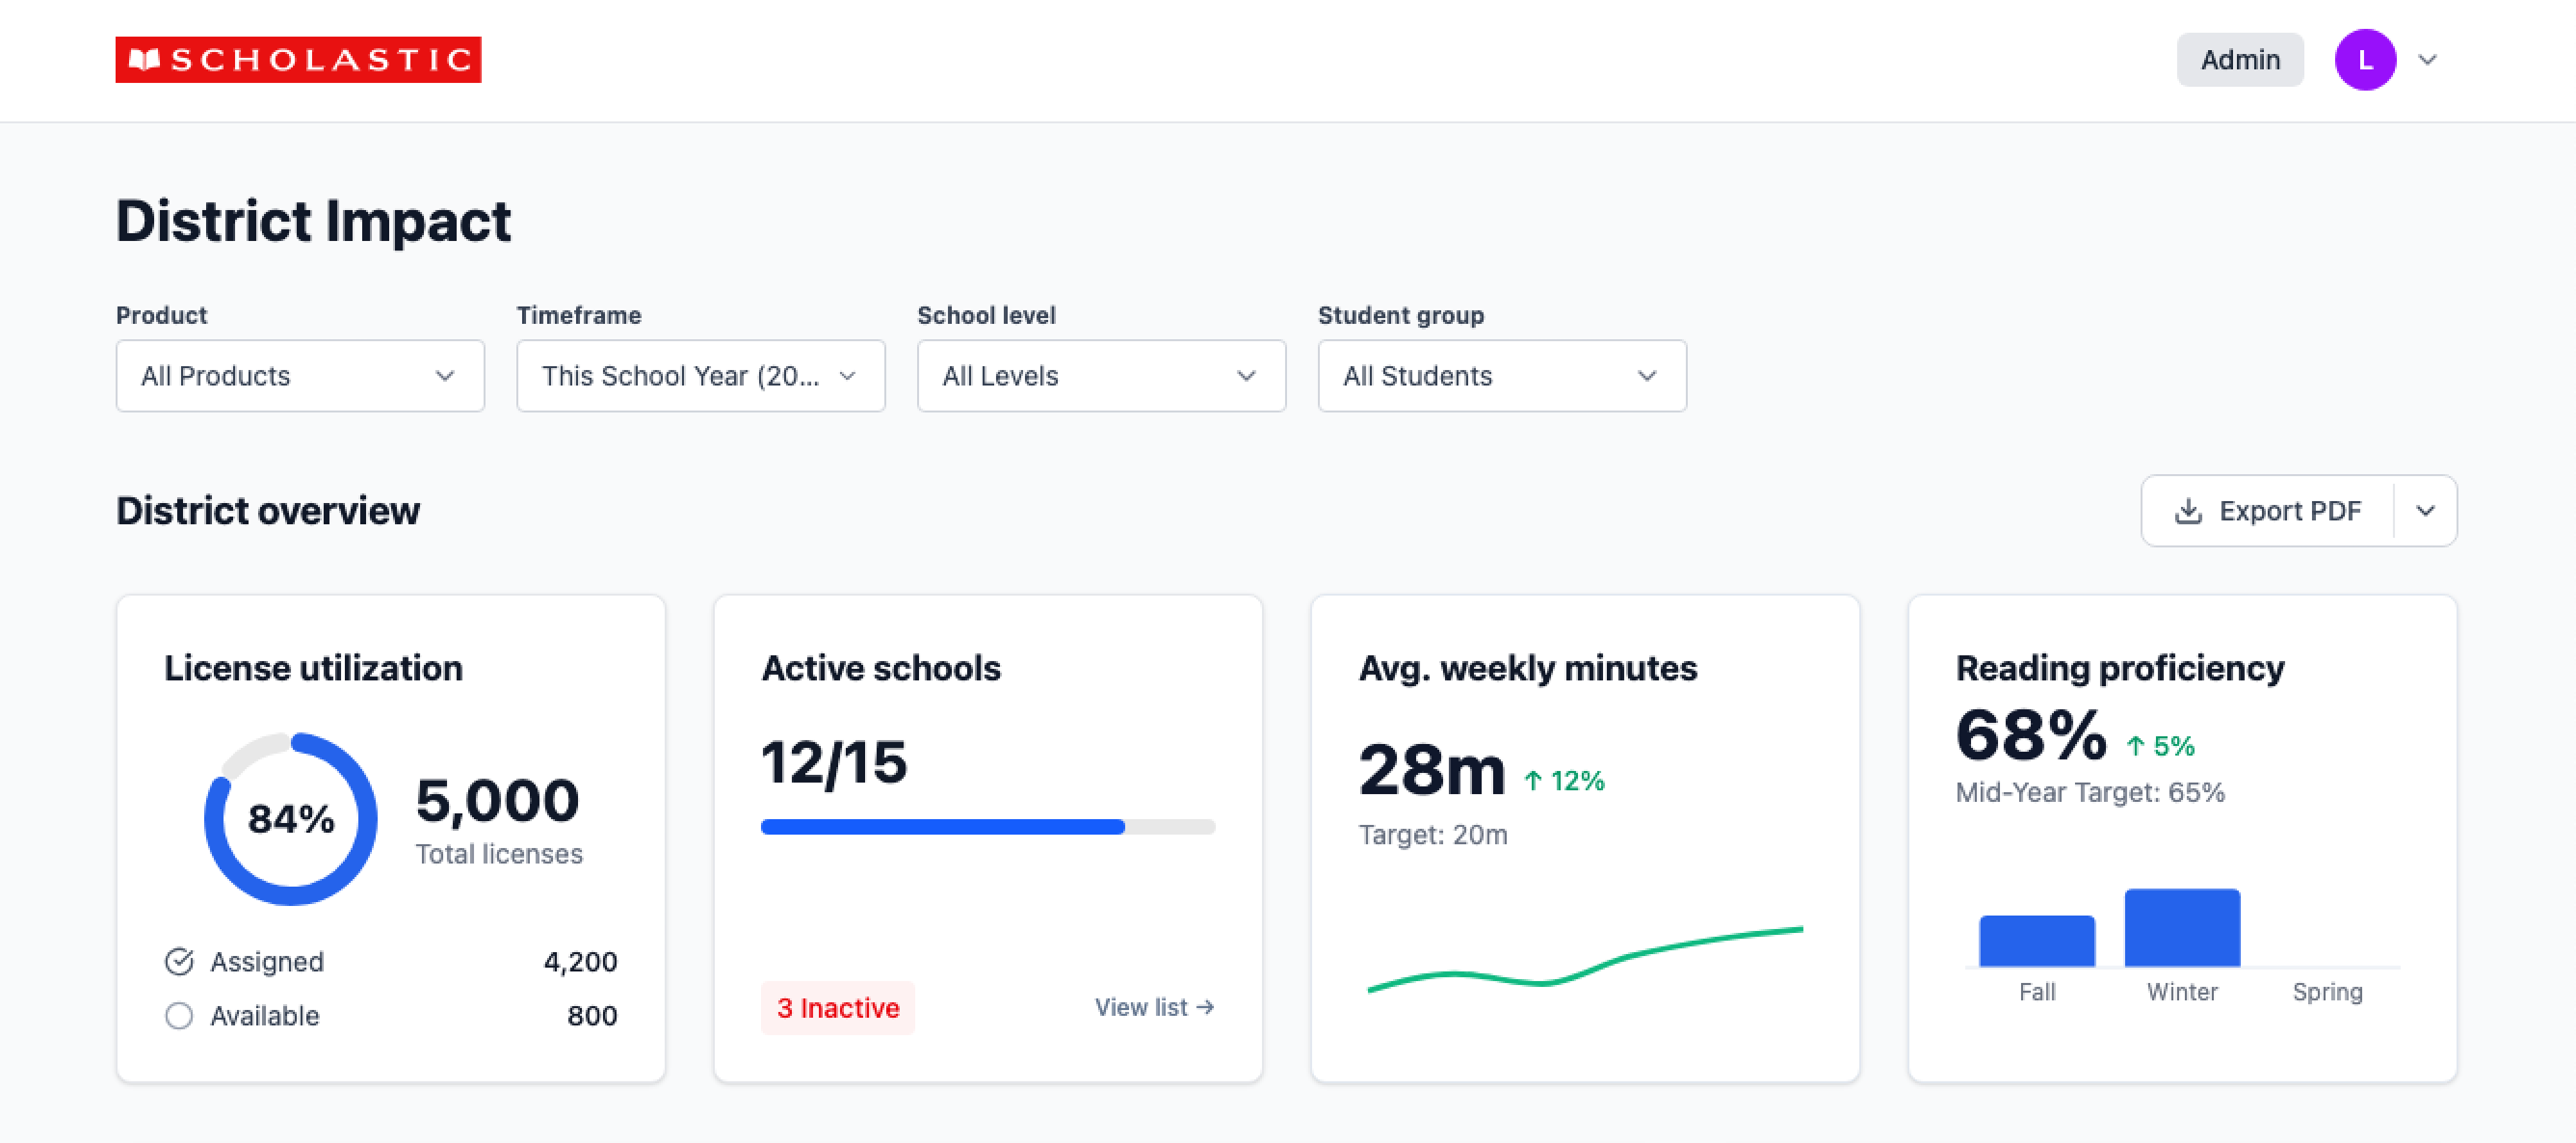
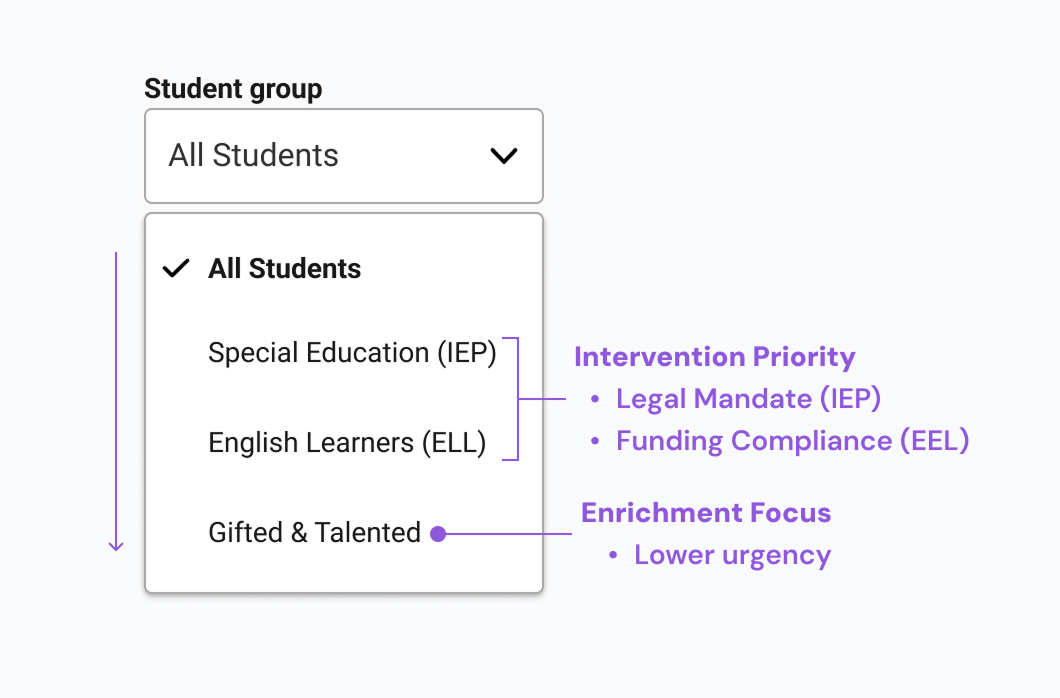

Designing With data

I used Figma analytics to track how components were being used, where they were getting detached, and where designers were running into friction. When I noticed a pattern, I reached out directly to designers to understand the real problem behind it.

One clear example was the Tabs component. The first version only supported three items, but designers kept detaching it because their use cases needed more flexibility. After hearing that feedback, I expanded the component so teams could add more tabs. Once I shipped the update, detachments dropped and consistency across products improved.

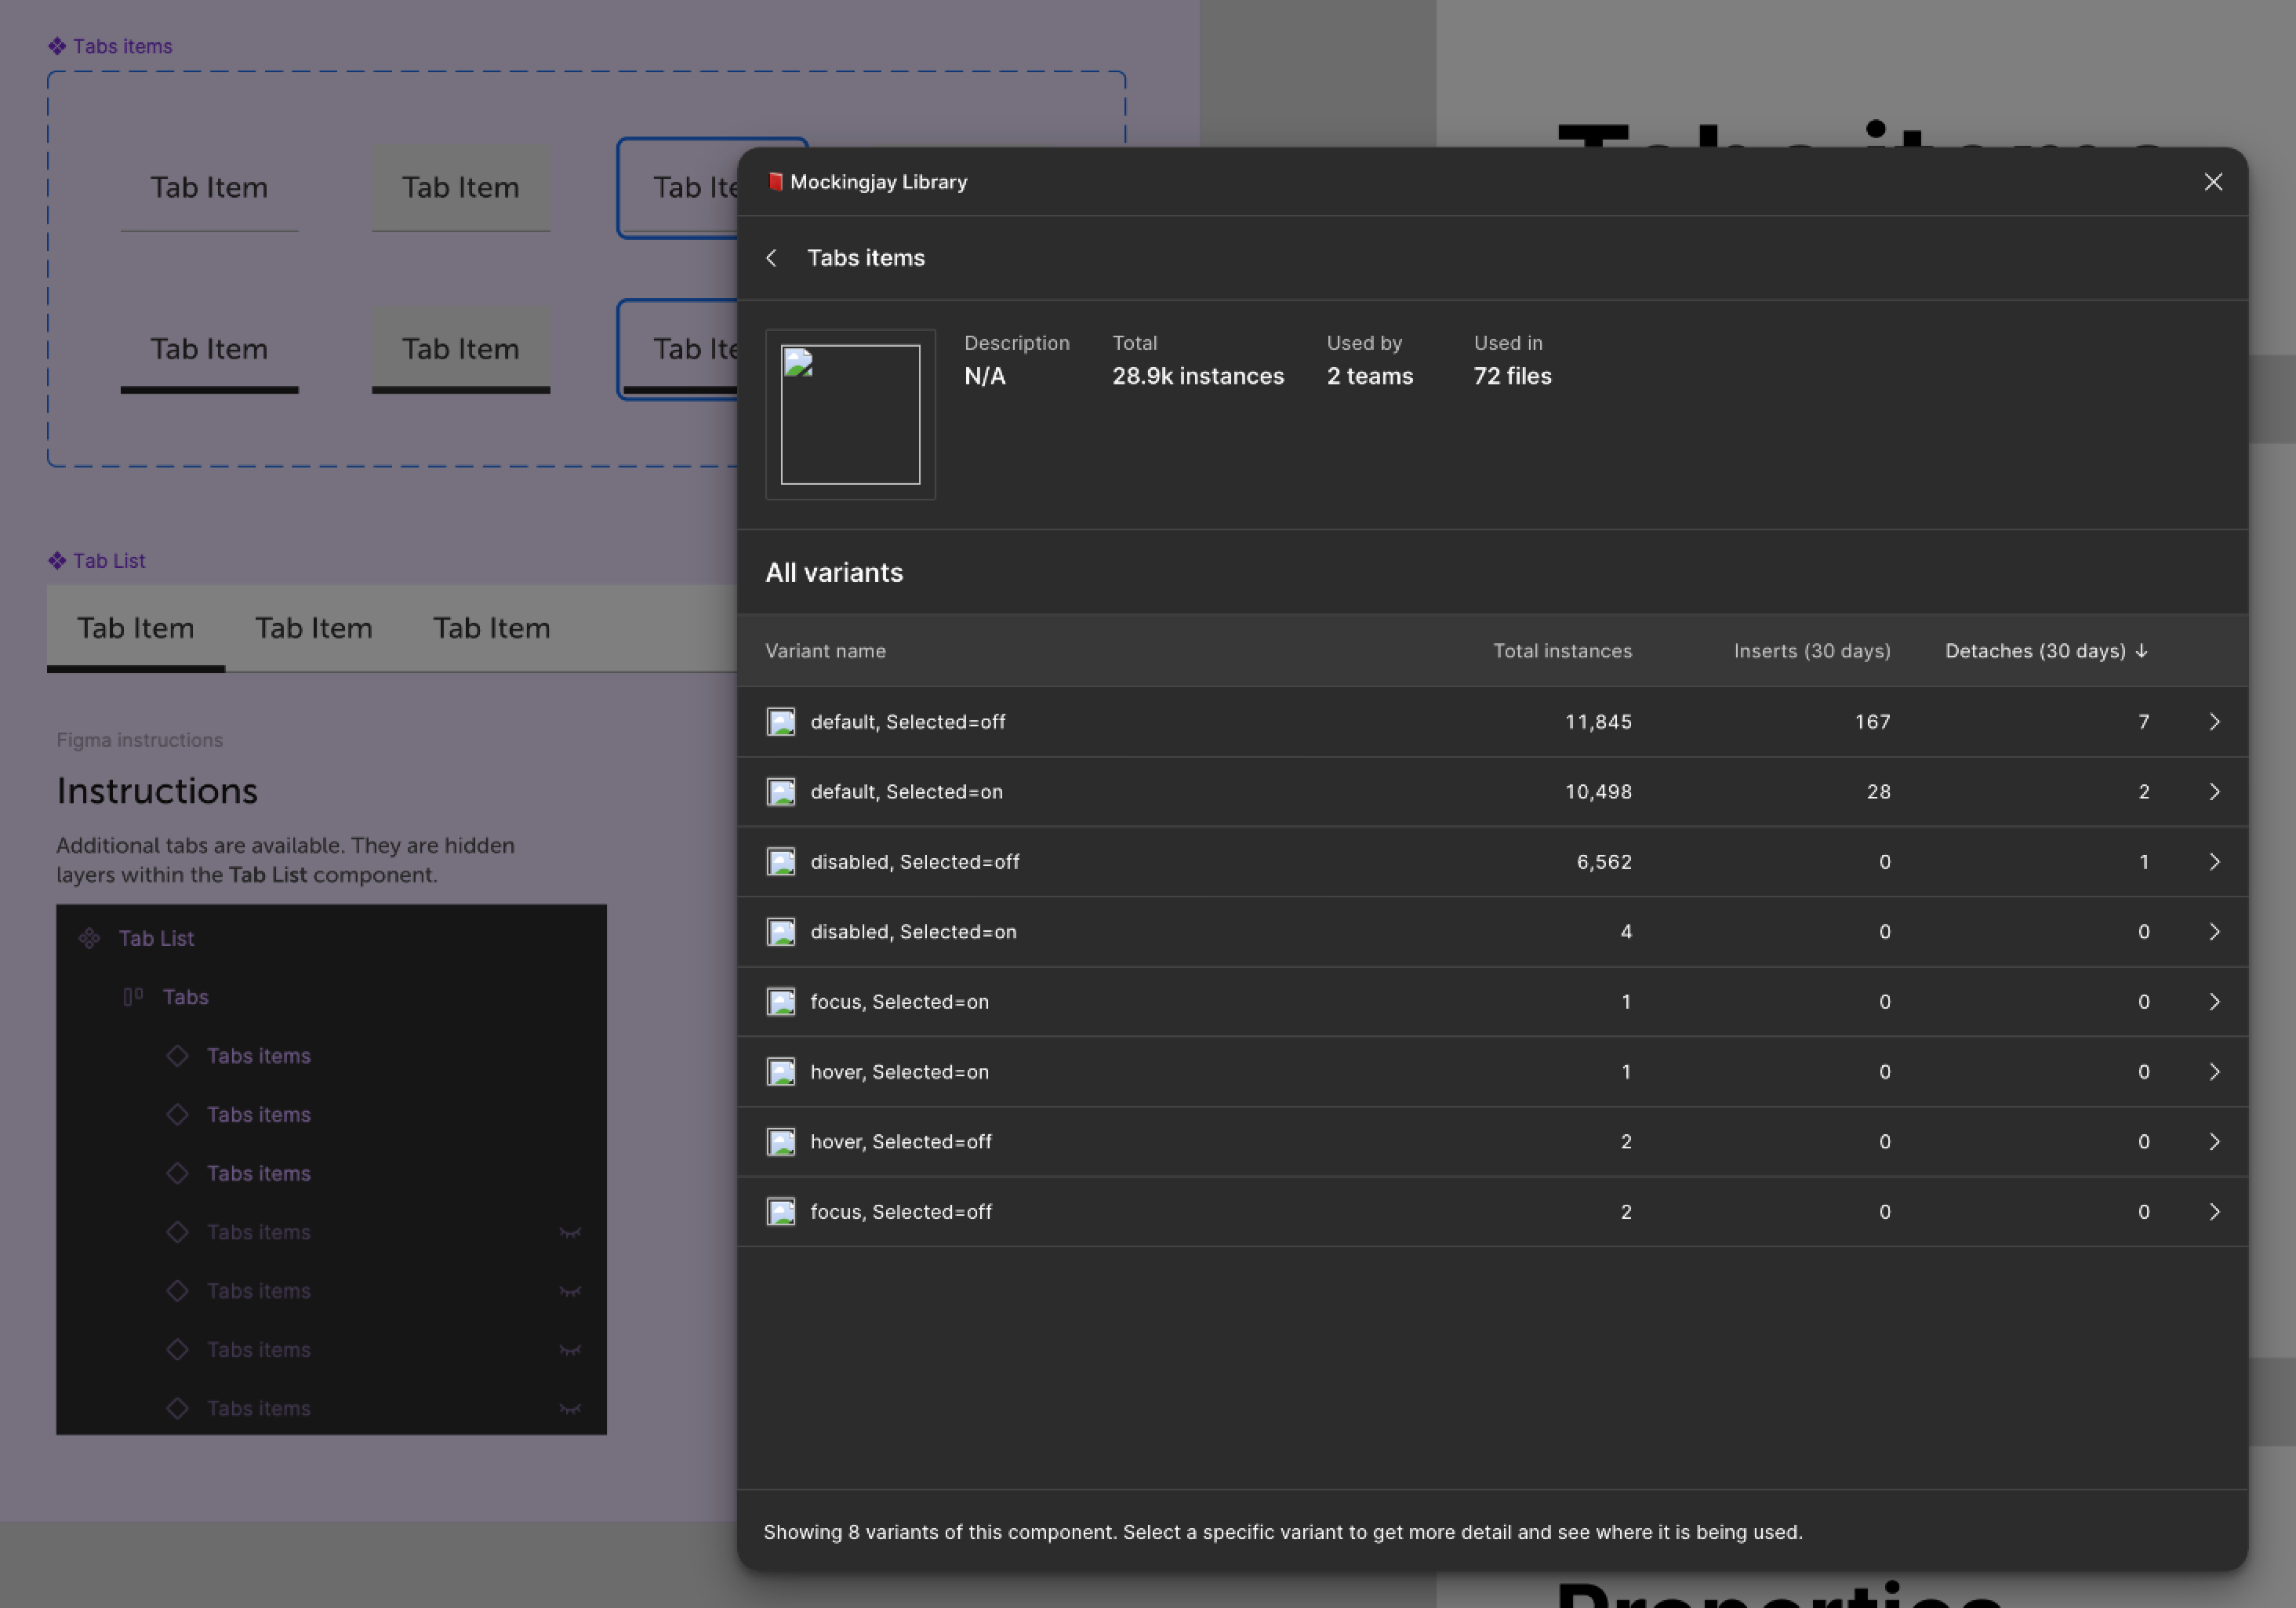
Figma analytics showing component usage


Government With Boundaries

In a design system, boundaries keep the whole organization moving in the right direction. I learned early that I could not say yes to every one-off request. If I tried, the system would slow down and lose trust.

So I kept it simple.

If a component supported multiple teams, helped us scale, or aligned with company goals, it moved forward. If it only solved one team’s unique problem, I guided them toward local solutions instead.

Setting clear expectations, being transparent, and explaining the “why” made collaboration easier. It kept the system healthy, and it helped teams understand how to work with me while still feeling supported.

Setting boundaries with transparency and care

Championing The System

I stayed close to the teams using the system. I opened a dedicated Teams channel so people always had a place to ask questions, share ideas, or get quick help. I also hosted regular office hours and live demos so we could walk through new components together and make sure everyone felt supported.

Any time something shipped or changed, I shared clear updates with context and links so teams always knew what was new and why it mattered. The goal was to make the system feel approachable, helpful, and easy to use.

Over time, people began reaching out earlier in their process, asking for guidance, and even promoting system updates on their own. That is when you know a design system is doing its job.

Clear updates with context and links


Real Adoption, Real Momentum

As the system matured, teams began using Mockingjay without being pushed. It showed up in product demos, planning sessions, and cross-team discussions.

Impact

  • Designers and engineers became advocates
  • More teams asked to onboard
  • Releases shipped faster and more consistently
  • The system became part of the natural workflow
  • Teams trusted the system because it solved real problems


Mockingjay started as a tool, but it grew into a shared culture.

People who use the system, love it, and help spread the word.


Reflection: The system is easy, people are hard

I learned that the system is the easy part. The real work is supporting people who are under pressure and juggling deadlines. Sometimes that stress shows up as frustration with the system, but it is never personal. I learned to listen, stay patient, and meet teams where they are. When people feel heard and supported, the entire system gets better. That is what makes the work meaningful.

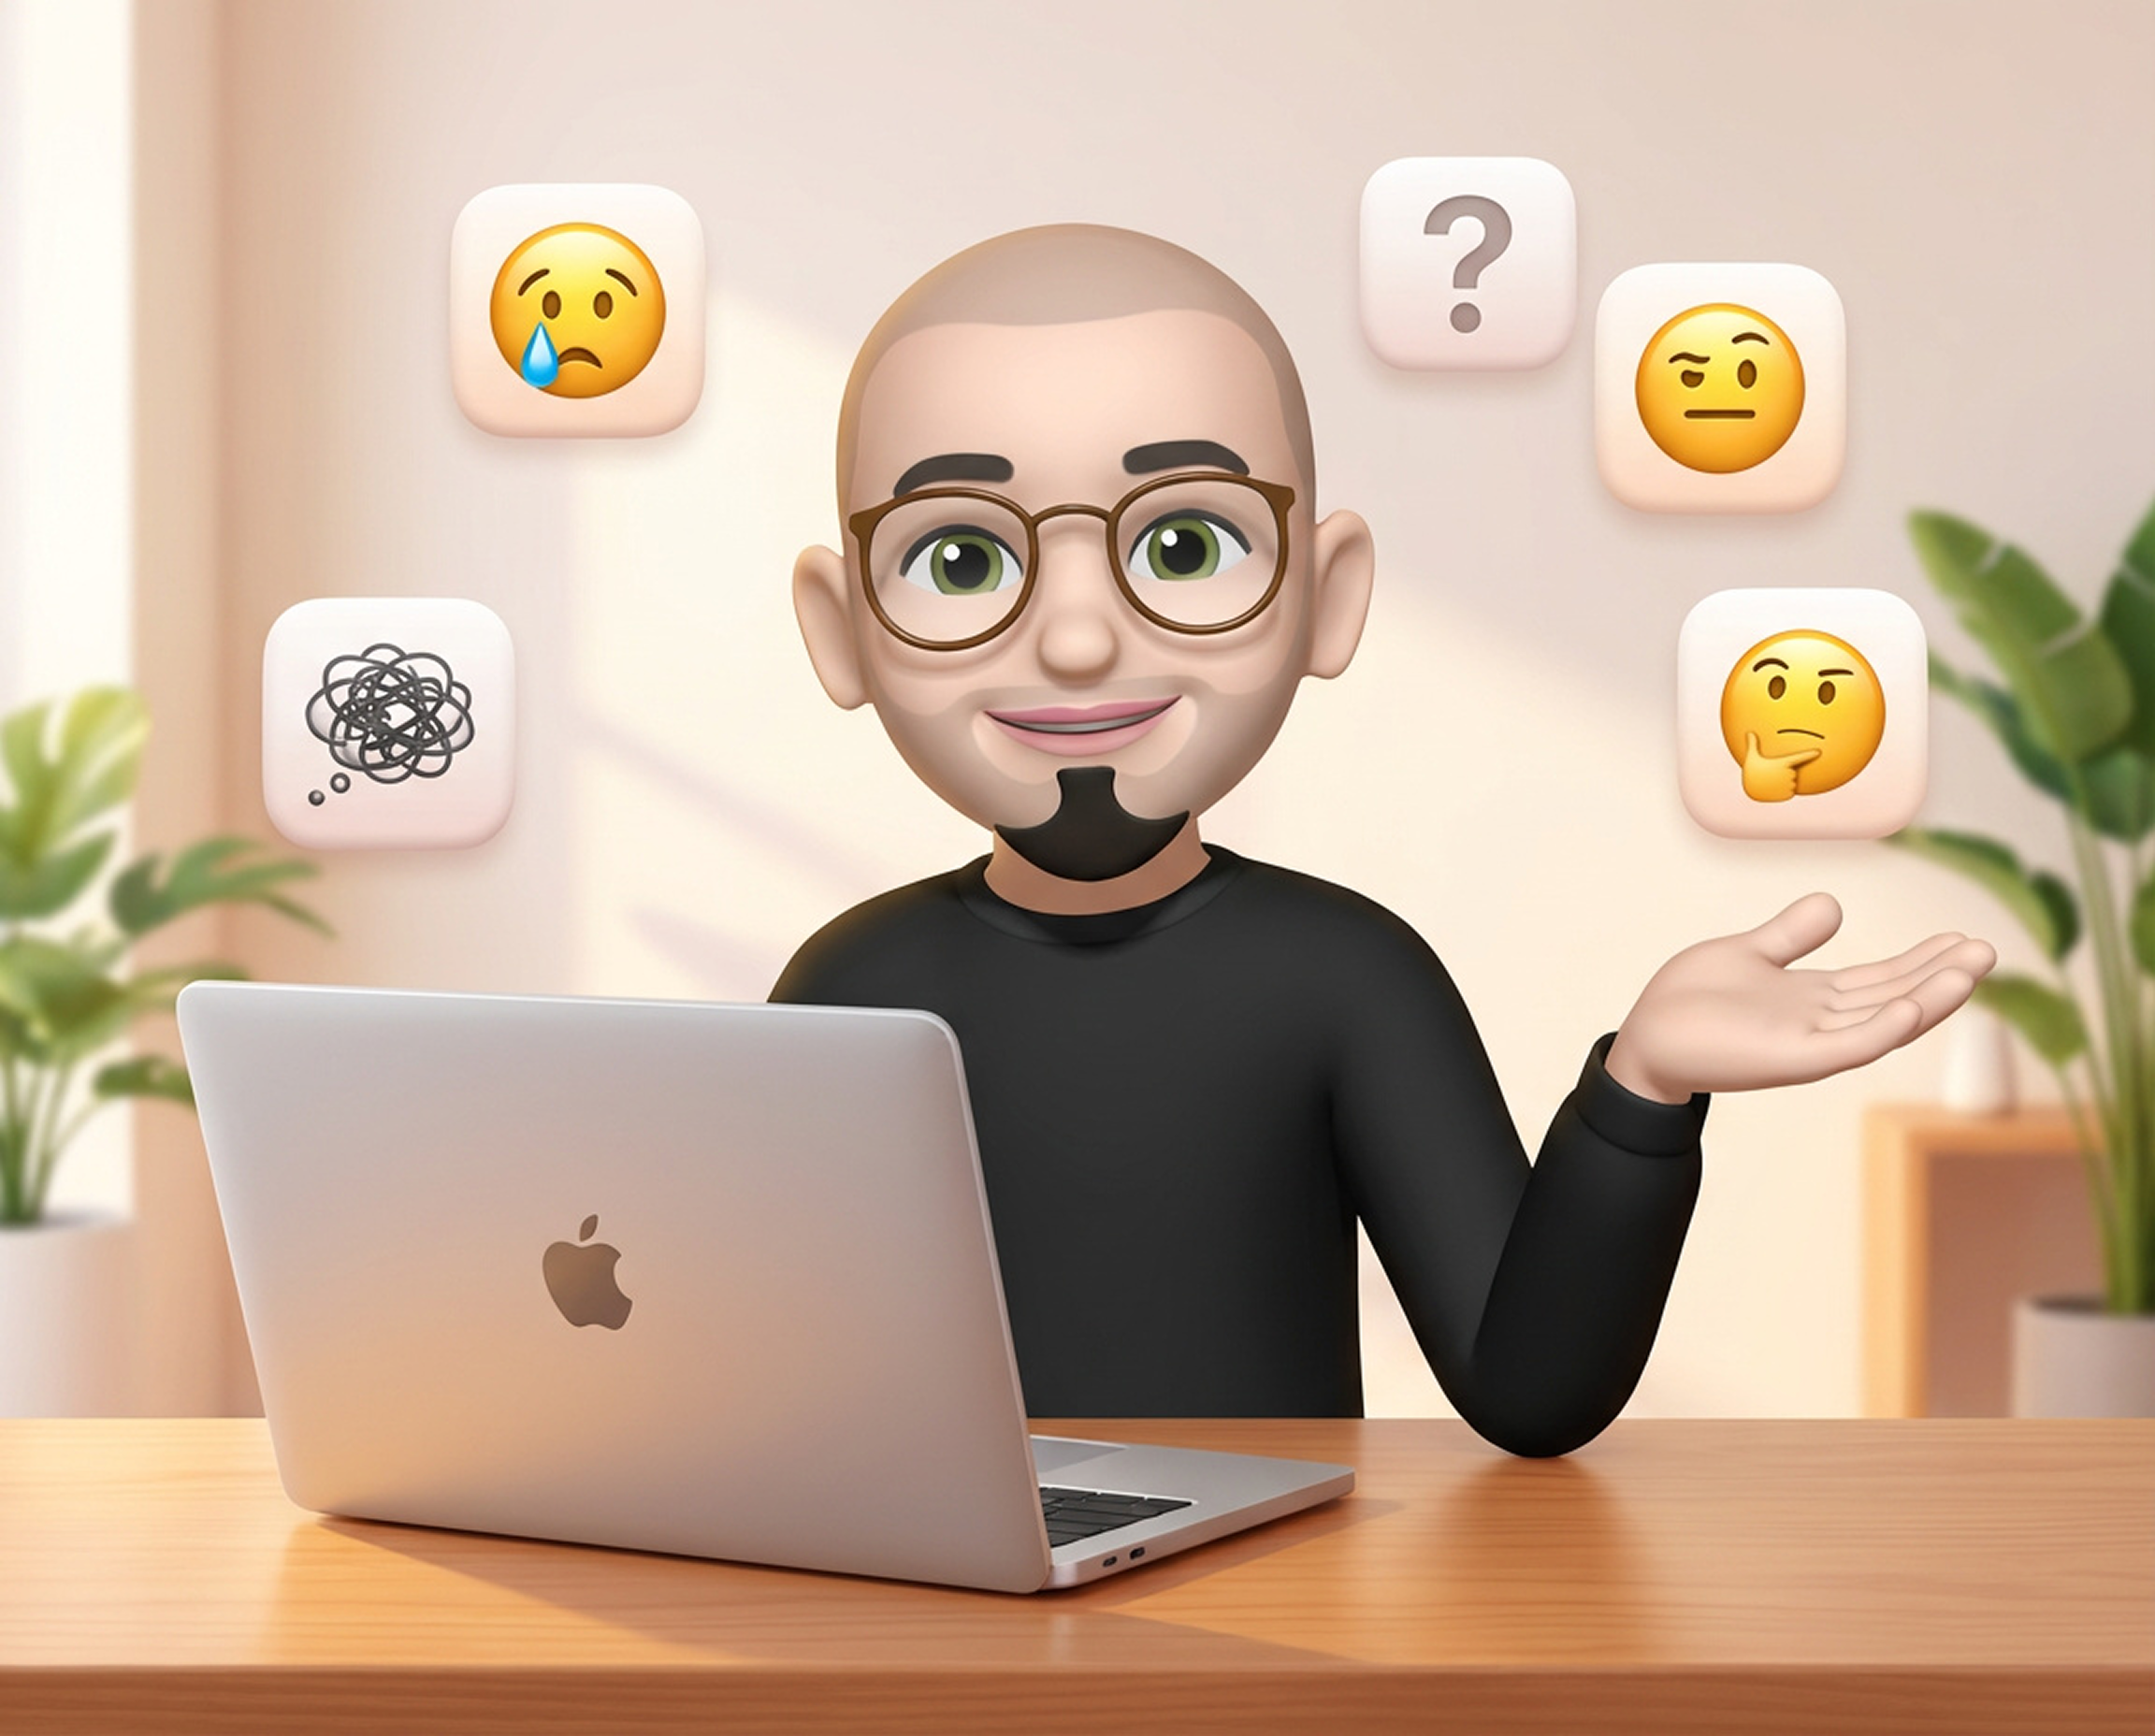
Design systems succeed when people feel heard


Personal Reflection

Mockingjay was more than a system. It was a team effort that showed me how much is possible when people trust each other and work toward a clear vision. Leading it helped me understand the kind of designer I want to keep growing into: someone who builds with people, listens with intention, and helps teams move with clarity and confidence.

Takes a village to make a design system work

Design

Yahoo – Rize Design System

How I helped evolve Yahoo’s design system to support consistency, accessibility, and team adoption across a global product ecosystem.

Media

Digital

Role: Staff Product Designer

Context: Enterprise EdTech (B2B SaaS)

Core Focus: Product Strategy, Data Ethics, AI Prototyping

Timeline: 4 Weeks (Discovery to High-Fidelity Prototype)

Team: 1 Staff Designer (Me), 2 Product Manager, 2 Engineers (Consulted)

Key Outcomes

  • Strategic Pivot: Moved the product from "Passive Reporting" to "Diagnostic Intervention."
  • Equity Focus: Established Title I compliance through segmented student group filtering.
  • Business Value: Validated the "Home Access" revenue model via usage visualization.

The Challenge

District Administrators are busy people. They control million-dollar budgets and are responsible for thousands of students, but their old dashboard was failing them: it was a "data dump"—rows of numbers that didn't tell a story.

They couldn't answer the two most important questions: "Is the software working?" and "Which schools need my help right now?"

My goal was to turn this dashboard from a passive report card into a helpful diagnostic tool.

Legacy State: The original concept presented a "Data Dump"—a dense grid of unprioritized metrics that forced users to manually calculate performance gaps.

Mapping The Model

Hypothesis & Research

We gathered stakeholders to map out the 'Data Narrative' to determine exactly what an Admin needs to know to do their job.

The Research Reality Check: We took our initial concepts and put them in front of District Administrators. The feedback revealed a critical misalignment in our assumptions.

  • Our Hypothesis (The Inventory Model): "Admins need a comprehensive directory of every school, sorted A-Z, to track inventory."
  • User Feedback (The Triage Model):"I don't have time to scroll through 50 schools. I need to know who is winning so I can praise them, and who is drowning so I can save them."

The Strategy: This insight drove the architecture of the entire dashboard. We realized we needed two distinct layers: a "Pulse Check" for the district and a targeted "Triage Tool" for specific schools.

Synthesis: Transforming raw stakeholder requests into a "Data Narrative." We moved from an "Inventory" model (A-Z lists) to a "Triage" model (Priority Intervention).

Approach

  • Principles:
    • Make frequent choices efficient
    • Favor usability over maintenance
    • Bake in visual decisions
    • Bridge gaps between design and code

Architecting the Executive Summary

Hierarchy & Value Chain

First, we addressed the "Pulse Check." I structured the top of the dashboard not as a random collection of metrics, but as a linear Value Chain that tells the story of the investment from Input to Output:

  1. License Utilization (Financial Input):"Are we getting what we paid for?" This is the fiscal baseline.
  2. Active Schools (Operational Success):"Is the software actually deployed?" This measures implementation health.
  3. Weekly Minutes (Behavioral Engagement): "Are students using it?" This validates adoption fidelity.
  4. Reading Proficiency (Educational Impact): "Is it working?" This is the ultimate return on investment.

The Pulse Check: Top-level metrics are ordered by the investment value chain: Financial Input → Operational Success → Behavioral Engagement → Educational Impact.

The Filter Strategy: Defining Context To support this narrative, I limited the global controls to four essential "Context Keys":

  • Product (Scope): Which tool are we analyzing?
  • Timeframe (Fiscal): Aligning data to the Academic Year (Aug-June) rather than the calendar year.
  • School Level (Segment): Separating Elementary (Foundational) from High School (Intervention).
  • Student Group (Equity): Ensuring no demographic is hidden in the average.

Information Architecture & Equity

System Thinking: Ordering by Risk, Not Alphabet

To make these metrics actionable, we needed to let Admins slice the data by population. However, standard alphabetical lists for student groups often bury the most urgent cohorts.

I re-architected the "Student Group" filter using a logic based on Intervention Priority:

  • Priority 1: Legal Mandate (IEP): I placed Special Education at the top. This group carries the highest federal compliance risk and requires immediate administrative oversight.
  • Priority 2: Funding Compliance (ELL): English Learners follows, representing critical Title III funding requirements.
  • Priority 3: Enrichment Focus: Gifted & Talented is placed last, as it represents an optimization goal rather than an immediate risk factor.

The Impact: This deliberate Information Architecture guides the Admin’s eye to high-stakes populations first, ensuring equity gaps are spotted before enrichment analysis begins.

Intervention Priority: I reordered the filter logic to prioritize Legal Mandates (IEP) and Funding Compliance (ELL) over enrichment, aligning the UI with the administrator's risk profile.

The Diagnostic Layer

Solving the "Inventory vs. Triage" Problem

With the high-level health established, I returned to the core insight from our research: Admins don't want an A-Z list; they want to know who needs help.

I designed the "School Performance" leaderboard to replace the old directory. Instead of a search bar, I built it around a specific toggle: Top Performing vs. Needs Attention.

The Logic: This respects the administrator's dual mental model. They can instantly toggle between Celebration (Validating success) and Intervention (Triaging struggling schools) without sifting through pages of data.

The Triage Tool: Replacing the standard search bar with a "Needs Attention" toggle allows Admins to instantly isolate struggling schools without sifting through pages of data.

Closing the Loop: Embedded Action

Operational Efficiency & Adoption

Data is useless without action. A common frustration with legacy dashboards is the "Dead End Insight"—seeing a problem (e.g., "Low Teacher Activation") but having to navigate away to a separate "User Management" tool to fix it.

I designed the "Teacher Activation" card to close this loop directly on the dashboard.

  • The Alert: The card uses semantic formatting (Warning banner) to flag the specific bottleneck: "17 teachers pending registration."
  • The Embedded Action: Instead of just reporting the number, I placed a "Resend Invites" button directly within the widget context.
  • The Win: This transforms a passive metric into an active workflow. It reduces a multi-step administrative task into a single click, empowering Admins to drive product adoption immediately without losing context.

Embedded Action: Placing the "Resend Invites" button directly within the alert card removes friction, turning a passive metric into an immediate workflow.

Meeting Students Where They Are

Business Strategy & Mission Alignment

The district pays extra for "Anytime Access" licenses, so we needed to prove that learning was actually happening outside of school hours.

Visualizing the 'Anytime' Promise: This is the activity often hidden in aggregate data. By segmenting usage trends (Weekdays vs. Weekends), we give Administrators concrete proof that learning continues in unstructured environments, validating the ROI of home-access licenses.

I designed the "Daily Usage" chart with a Weekday vs. Weekend toggle to visualize this story.

  • The Data Story: Weekday usage shows a sharp spike during school hours (Compliance). Weekend usage shows a gentle curve throughout the day, which signals Voluntary Engagement.
  • The Outcome: This chart proved that our mobile strategy is working. It showed administrators that students are choosing to engage with the app on their own time, validating the investment in home access.

Visualizing ROI: The "Weekend" toggle reveals a distinct usage pattern (a gentle curve vs. the sharp school-day spike), providing data-backed proof of voluntary home engagement.

Designing for Trust

Data Ethics & Integrity

In EdTech, data represents a child's education. A common trap is "Vanity Metrics"—making numbers look better than they are to keep the customer happy. I established a core principle of Honesty over Vanity.

The "Zero-Baseline" Rule: We ensured all bar charts start at zero. Truncating the Y-axis to exaggerate small gains is a dark pattern we refused to use.

Semantic Colors: Early iterations relied on arbitrary brand colors (Purple, Orange) which looked appealing but lacked "cognitive signal." I shifted to a Semantic System where color equals meaning:

  • Blue: Volume/Neutral (Minutes read).
  • Amber: Action Required (Needs Attention).
  • Green: Success State (On Track).

Result: The dashboard communicates priority instantly, without requiring the user to read every label.

Data Ethics: Using semantic colors (Amber/Green) and enforcing zero-baselines ensures the dashboard communicates honestly without relying on "vanity metrics."

The Process: Designing with Code & AI

Technical Craft

I skipped the traditional weeks of static mockups. Instead, I utilized an AI-assisted development workflow to prototype directly in React and Tailwind CSS.

This approach allowed me to move from "drawing pictures" to "engineering logic" in real-time.

  • Static Tools Lie, Code Tells the Truth: By working in the browser, I caught layout bugs on mobile—like charts collapsing to zero height—that static tools hid.
  • Designing for the Chromebook Reality: School districts run on Chromebooks, which are often hybrid touch devices. I refactored the charts to prioritize direct axis labeling and touch-friendly interactions, ensuring data wasn't locked behind a "hover" state that many users can't access.
  • The "Zero-Friction" Handoff: I partnered with Engineering early to validate component feasibility, then handed off production-ready logic, cutting engineering setup time in half.

The "Chromebook Reality": Prototyping in code allowed me to solve for touch-based interactions and responsive layout bugs that static design tools missed.

The Conclusion

By listening to users, respecting the data, and designing for the reality of Chromebook-first classrooms, we transformed a "Reporting Tool" into a "Strategic Asset." The final design didn't just show administrators what was happening; it gave them the diagnostic clarity to understand why.

From Paralysis to Action: The ultimate measure of success was shifting the administrator's emotional relationship with data. We moved them from "Analysis Paralysis" (stress/confusion) to "Diagnostic Confidence," enabling them to make million-dollar decisions with clarity.

Future Vision: The AI-Enabled Administrator

From Diagnostic to Prescriptive

If I were to take this product to the next level, I would move beyond visualizing data to synthesizing it.

  • Generative Insights: I would introduce a Natural Language Query feature (e.g., "Show me which schools are trending down since October"), transforming the dashboard from a passive screen into an active analyst.
  • Strategic Benchmarking: To align User Success with Business Growth, I would introduce Peer Benchmarking. By showing Admins how their district compares to similar cohorts (e.g., "Your math scores are 12% below peer districts"), we can contextually recommend specific Scholastic products to close the gap—turning "Sales" into "Consultative Problem Solving."
Design

Yahoo – Rize Design System

How I helped evolve Yahoo’s design system to support consistency, accessibility, and team adoption across a global product ecosystem.

Media

Digital

Context + Problem

Business Problem
Yahoo’s ad tech tools were inconsistent, inefficient, and hard to maintain. Multiple teams worked off different design libraries, leading to redundant tools, wasted time, and higher dev costs.

People Problem
Designers were constantly detaching components, suffering from poor documentation, and lacked a single source of truth. Design maturity was low, and collaboration was difficult.

Your Role
Design system lead (alongside 1 PM + 1 visual designer):

  • Drove the Figma migration
  • Designed the component library
  • Led training, advocacy, accessibility audits
  • Created documentation and system principles

Goals & Constraints

  • Goals:
    • Consolidate tools
    • Speed up product development
    • Improve design quality + accessibility
    • Increase collaboration and adoption

  • Constraints:
    • Migrated mid-rebrand (Verizon branding retired)
    • Figma learning curve for many designers
    • Leadership wanted 6–12 month project done in 3

Approach

  • Principles:
    • Make frequent choices efficient
    • Favor usability over maintenance
    • Bake in visual decisions
    • Bridge gaps between design and code
  • Design Tactics:
    • Separated distinct variants (e.g., button styles) for faster drag-and-drop
    • Used labels, emoji, and screenshots to enhance discoverability
    • Created interactive prototypes for non-design stakeholders
    • Added metadata (Gear, Cog, Settings, etc.) to support diverse vocabularies
    • Surface GitHub links to enable cross-functional collaboration

  • Culture Work:
    • Co-created with designers across teams to build trust
    • Advocates presented at meetings, not just you
    • Added a versioning system to boost transparency and reduce fear of updates
    • Kept documentation at a 4th-grade reading level to promote clarity and inclusion

Outcome

  • Migrated from Sketch to Figma successfully
  • High system adoption with little-to-no component detachment
  • Data table component alone had over 18,000 uses and only 22 detachments
  • Advocates on every team helped scale support without you being a bottleneck

Reflection

  • What I’d change:
    • Invest earlier in design tokens
    • Plan for responsiveness earlier
    • Build documentation in real-time to prevent backlog

  • What I learned:
    • Design systems live or die by company culture
    • The best system isn’t just scalable—it’s usable
    • Trust is the foundation; everything else is maintenance
Design

Yahoo – Rize Design System

How I helped evolve Yahoo’s design system to support consistency, accessibility, and team adoption across a global product ecosystem.

Media

Digital

Context + Problem

Business Problem
Yahoo’s ad tech tools were inconsistent, inefficient, and hard to maintain. Multiple teams worked off different design libraries, leading to redundant tools, wasted time, and higher dev costs.

People Problem
Designers were constantly detaching components, suffering from poor documentation, and lacked a single source of truth. Design maturity was low, and collaboration was difficult.

Your Role
Design system lead (alongside 1 PM + 1 visual designer):

  • Drove the Figma migration
  • Designed the component library
  • Led training, advocacy, accessibility audits
  • Created documentation and system principles

Goals & Constraints

  • Goals:
    • Consolidate tools
    • Speed up product development
    • Improve design quality + accessibility
    • Increase collaboration and adoption

  • Constraints:
    • Migrated mid-rebrand (Verizon branding retired)
    • Figma learning curve for many designers
    • Leadership wanted 6–12 month project done in 3

Approach

  • Principles:
    • Make frequent choices efficient
    • Favor usability over maintenance
    • Bake in visual decisions
    • Bridge gaps between design and code
  • Design Tactics:
    • Separated distinct variants (e.g., button styles) for faster drag-and-drop
    • Used labels, emoji, and screenshots to enhance discoverability
    • Created interactive prototypes for non-design stakeholders
    • Added metadata (Gear, Cog, Settings, etc.) to support diverse vocabularies
    • Surface GitHub links to enable cross-functional collaboration

Design

Yahoo – Rize Design System

How I helped evolve Yahoo’s design system to support consistency, accessibility, and team adoption across a global product ecosystem.

Media

Digital

Context + Problem

Business Problem
Yahoo’s ad tech tools were inconsistent, inefficient, and hard to maintain. Multiple teams worked off different design libraries, leading to redundant tools, wasted time, and higher dev costs.

People Problem
Designers were constantly detaching components, suffering from poor documentation, and lacked a single source of truth. Design maturity was low, and collaboration was difficult.

Your Role
Design system lead (alongside 1 PM + 1 visual designer):

  • Drove the Figma migration
  • Designed the component library
  • Led training, advocacy, accessibility audits
  • Created documentation and system principles

Goals & Constraints

  • Goals:
    • Consolidate tools
    • Speed up product development
    • Improve design quality + accessibility
    • Increase collaboration and adoption

  • Constraints:
    • Migrated mid-rebrand (Verizon branding retired)
    • Figma learning curve for many designers
    • Leadership wanted 6–12 month project done in 3
Jason Nocito via GQ Sports

Approach

  • Principles:
    • Make frequent choices efficient
    • Favor usability over maintenance
    • Bake in visual decisions
    • Bridge gaps between design and code
  • Design Tactics:
    • Separated distinct variants (e.g., button styles) for faster drag-and-drop
    • Used labels, emoji, and screenshots to enhance discoverability
    • Created interactive prototypes for non-design stakeholders
    • Added metadata (Gear, Cog, Settings, etc.) to support diverse vocabularies
    • Surface GitHub links to enable cross-functional collaboration

Design

Yahoo – Rize Design System

How I helped evolve Yahoo’s design system to support consistency, accessibility, and team adoption across a global product ecosystem.

Media

Digital

Context + Problem

Business Problem
Yahoo’s ad tech tools were inconsistent, inefficient, and hard to maintain. Multiple teams worked off different design libraries, leading to redundant tools, wasted time, and higher dev costs.

People Problem
Designers were constantly detaching components, suffering from poor documentation, and lacked a single source of truth. Design maturity was low, and collaboration was difficult.

Your Role
Design system lead (alongside 1 PM + 1 visual designer):

  • Drove the Figma migration
  • Designed the component library
  • Led training, advocacy, accessibility audits
  • Created documentation and system principles

Goals & Constraints

  • Goals:
    • Consolidate tools
    • Speed up product development
    • Improve design quality + accessibility
    • Increase collaboration and adoption

  • Constraints:
    • Migrated mid-rebrand (Verizon branding retired)
    • Figma learning curve for many designers
    • Leadership wanted 6–12 month project done in 3


Redirecting at the point of engagement led to user drop-off and lost value.


Approach

  • Principles:
    • Make frequent choices efficient
    • Favor usability over maintenance
    • Bake in visual decisions
    • Bridge gaps between design and code
  • Design Tactics:
    • Separated distinct variants (e.g., button styles) for faster drag-and-drop
    • Used labels, emoji, and screenshots to enhance discoverability
    • Created interactive prototypes for non-design stakeholders
    • Added metadata (Gear, Cog, Settings, etc.) to support diverse vocabularies
    • Surface GitHub links to enable cross-functional collaboration


Grounded design in real viewer behaviors—using personas built from social insights across key markets.


Translated viewing patterns into a full-screen, schedule-integrated layout tailored for long sessions.


2. Realistic prototyping + testing

Typical prototyping tools weren’t enough to simulate the login flow. I used a more advanced tool to model provider search, authentication, and stream start. Tested and iterated across internal departments.


Built and tested for real-world behavior—like users entering the wrong credentials.


3. Branding meets usability

Worked with marketing and on-air teams to transform heavy broadcast assets into scalable, mobile-friendly visuals. Used universal icons and clear language to support both English and Spanish-speaking users.


Original on-air graphics were built for broadcast—not optimized for digital or mobile environments.


Redesigned visual elements to strike a balance—preserving brand identity while improving scalability and usability across digital platforms.


Extended the system to Telemundo using inclusive iconography and a layout that worked seamlessly across both languages and audiences.

  • Design Tactics:
    • Separated distinct variants (e.g., button styles) for faster drag-and-drop
    • Used labels, emoji, and screenshots to enhance discoverability
    • Created interactive prototypes for non-design stakeholders
    • Added metadata (Gear, Cog, Settings, etc.) to support diverse vocabularies
    • Surface GitHub links to enable cross-functional collaboration

  • Culture Work:
    • Co-created with designers across teams to build trust
    • Advocates presented at meetings, not just you
    • Added a versioning system to boost transparency and reduce fear of updates
    • Kept documentation at a 4th-grade reading level to promote clarity and inclusion


Tested lightweight header CTAs across screen sizes to promote Live TV without disrupting content flow.


Designed contextual CTAs that blended with the platform’s UI—resulting in higher visibility without being mistaken for ads.


Optimized provider selection with quick-tap defaults and predictive search to streamline the login experience.


Designed around third-party login flows to set user expectations before handing off to external systems.


During commercial breaks, the schedule automatically expanded—using shadow and scroll cues to keep users engaged without manual interaction.


Introduced a theater-style layout post-authentication to shift users into a dedicated streaming mode, designed for long-form content.


Balanced business needs by clearly separating third-party on-demand content from our in-app clips—using layout and iconography to set user expectations.

Reflection

  • What I’d change:
    • Invest earlier in design tokens
    • Plan for responsiveness earlier
    • Build documentation in real-time to prevent backlog

  • What I learned:
    • Design systems live or die by company culture
    • The best system isn’t just scalable—it’s usable
    • Trust is the foundation; everything else is maintenance

"Can’t share the numbers—but let’s just say streams, impressions, and revenue all moved in the right direction.”


We didn’t get hard numbers—but the feedback was clear: streams, impressions, and revenue all went up.

We also elevated our design maturity:
• Brought user testing into the team’s process
• Created reusable personas
• Improved cross-team collaboration


Initial mobile layout didn’t account for live TV ad conflicts—leaving a blank space where an ad would’ve been. This was later addressed in the tablet phase with a more adaptive layout.

Design

Yahoo – Rize Design System

How I helped evolve Yahoo’s design system to support consistency, accessibility, and team adoption across a global product ecosystem.

Media

Digital

Context + Problem

Business Problem
Yahoo’s ad tech tools were inconsistent, inefficient, and hard to maintain. Multiple teams worked off different design libraries, leading to redundant tools, wasted time, and higher dev costs.

People Problem
Designers were constantly detaching components, suffering from poor documentation, and lacked a single source of truth. Design maturity was low, and collaboration was difficult.

Your Role
Design system lead (alongside 1 PM + 1 visual designer):

  • Drove the Figma migration
  • Designed the component library
  • Led training, advocacy, accessibility audits
  • Created documentation and system principles

Goals & Constraints

  • Goals:
    • Consolidate tools
    • Speed up product development
    • Improve design quality + accessibility
    • Increase collaboration and adoption

  • Constraints:
    • Migrated mid-rebrand (Verizon branding retired)
    • Figma learning curve for many designers
    • Leadership wanted 6–12 month project done in 3

Approach

  • Principles:
    • Make frequent choices efficient
    • Favor usability over maintenance
    • Bake in visual decisions
    • Bridge gaps between design and code
  • Design Tactics:
    • Separated distinct variants (e.g., button styles) for faster drag-and-drop
    • Used labels, emoji, and screenshots to enhance discoverability
    • Created interactive prototypes for non-design stakeholders
    • Added metadata (Gear, Cog, Settings, etc.) to support diverse vocabularies
    • Surface GitHub links to enable cross-functional collaboration